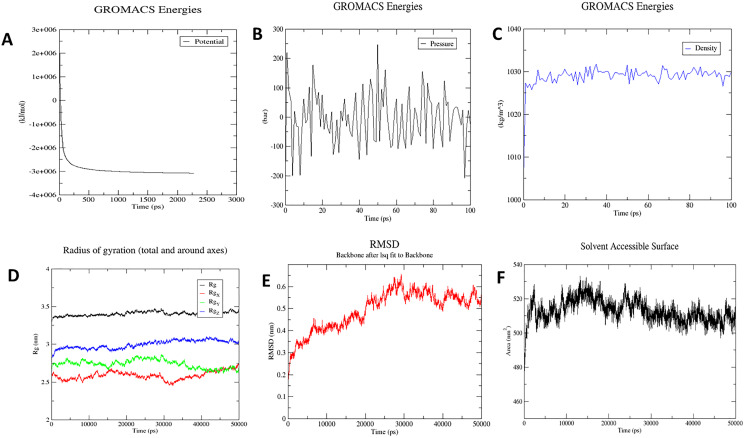
Figure 8. Molecular dynamics simulation study of protein-ligand complex representing.
(A) Potential energy variations (B) Pressure variations plot shows that the average pressure is −2.44361 bar during 100 ps (C) Density variations; plot shows that the average density is 1,028.87 kg/m3 during 100 ps (D) Radius of gyration (E) Root mean square deviation of the docked complex backbone for the time duration of 50 ns. (F) Solvent accessible surface area of the docked complex.

