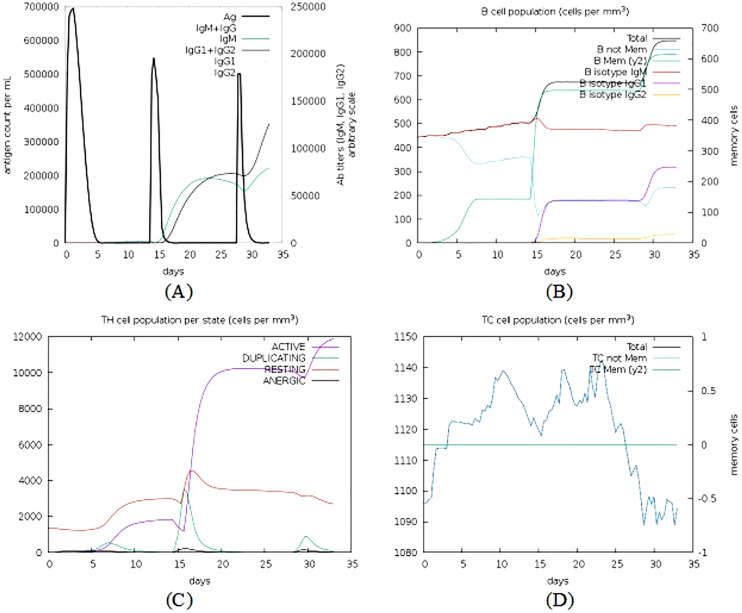
Figure 9. Immune simulations of the chimeric protein vaccine.
(A) Production of Immunoglobulins in response to successive antigen injections (different coloured peaks corresponding to different sub-classes of immunoglobulins and antigen represented by black vertical lines). (B) Changes observed in B-cell population (C) T-helper cells per state (resting state denotes the cells not presented with antigen while anergic state denotes cells showing tolerance to antigens due to repeated exposure). (D) Changes in T-cytotoxic cell population after administration of vaccine construct V1.

