Figure 5.
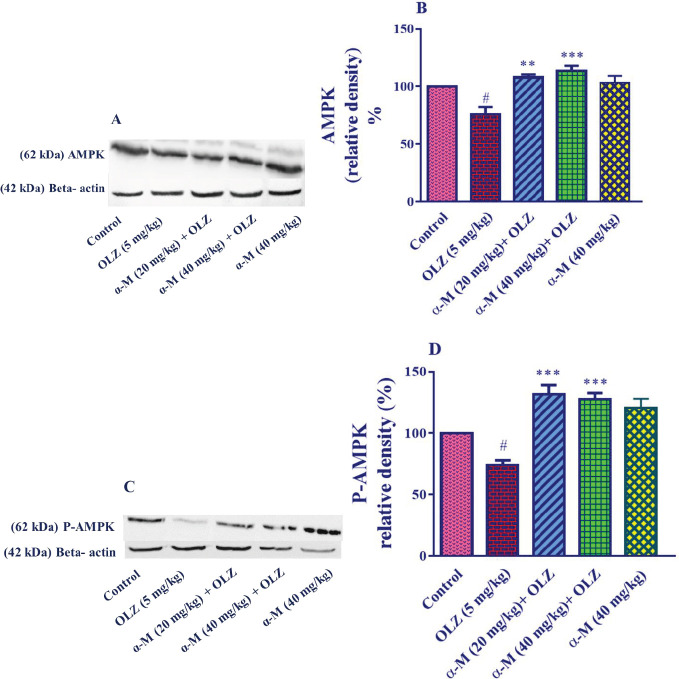
Effect of olanzapine and alpha-mangostin on liver tissue AMPK and P-AMPK levels in rats. Olanzapine (5 mg/kg), alpha-mangostin in different doses (20, 40 mg/kg) were injected intraperitoneally into the animals. The data is reported in Mean± SD (n=4). A, C: Represent immunoblot bands of the western blotting analysis. B, D: Represent quantitative presentation of the immunoblots. Data were analyzed by one-way ANOVA followed by Tukey's for multiple comparisons. Beta-actin is the loading protein control
OLZ: Olanzapine, α-M: alpha-mangostin
# P<0.05 compared with the control group, and *** P<0.001 and ** P<0.01 compared with the olanzapine group

