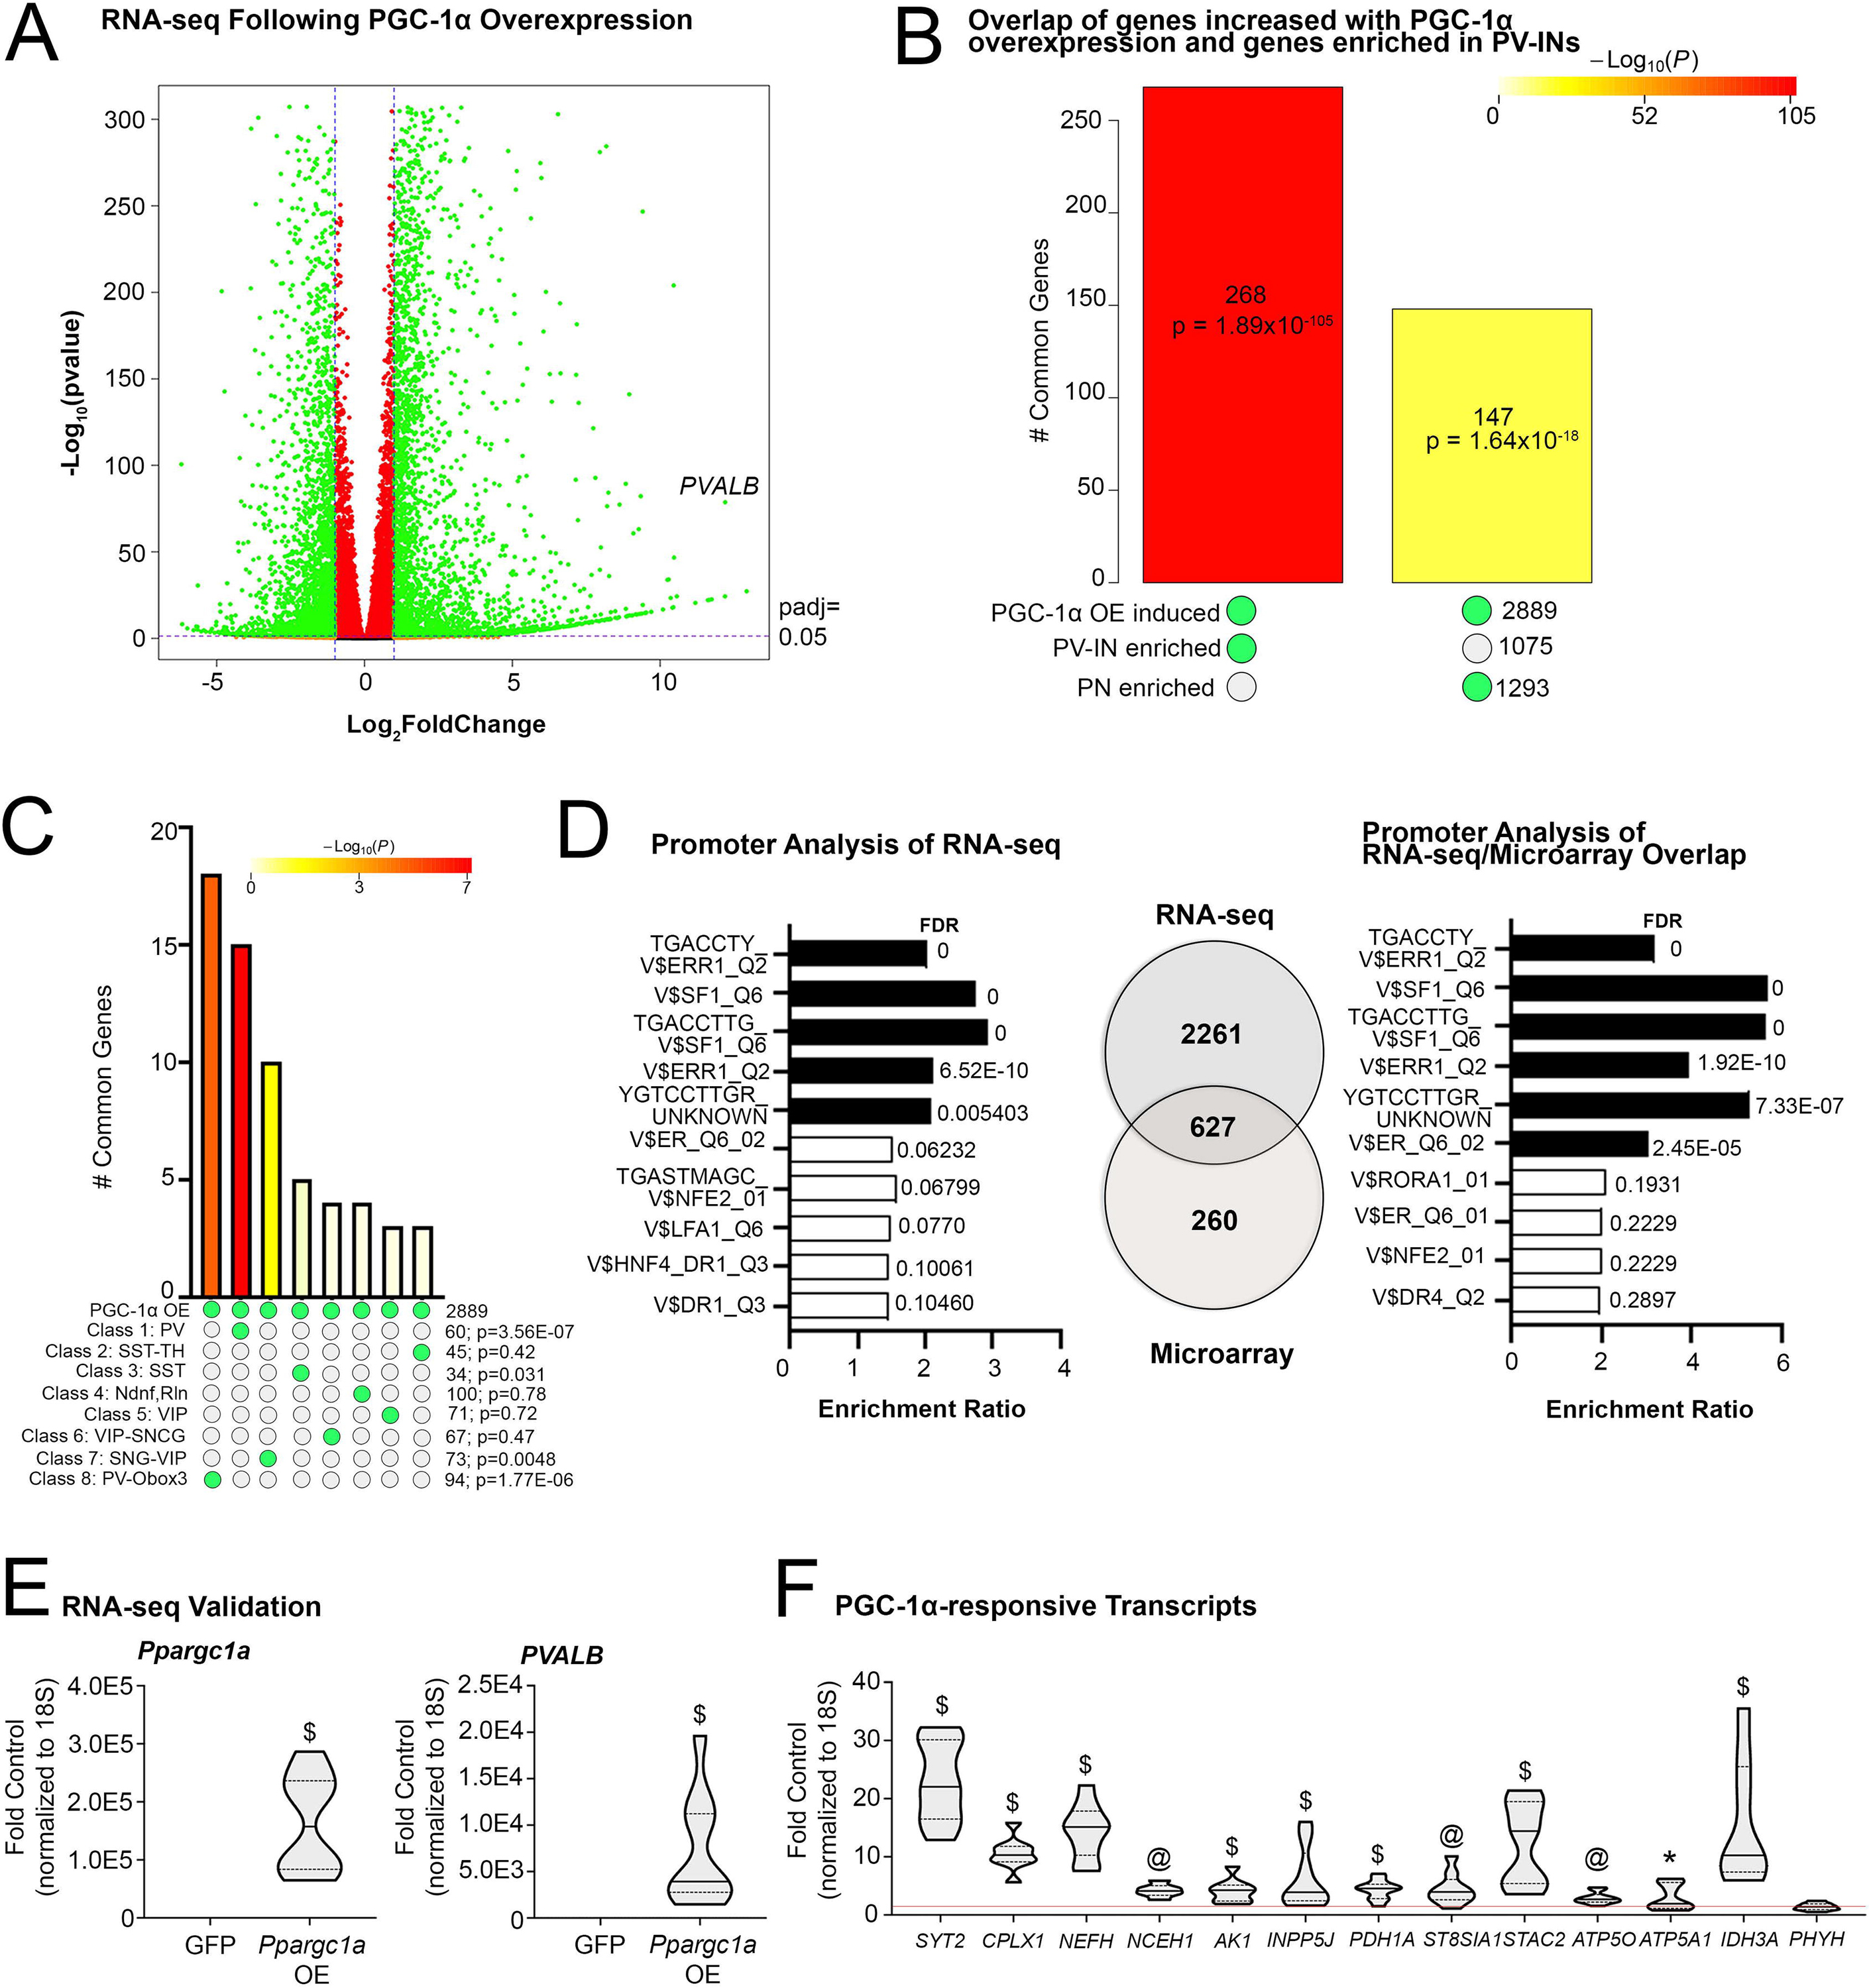
Fig. 1.

Transcriptional profiling of cells overexpressing PGC-1α reveals similarity to PV-IN profiles and identifies enriched transcription factor binding sequences in responsive genes. (A) RNA sequencing identified transcripts up- and down-regulated following AdV-CMV-Ppargc1a-ires-GFP (PGC-1αOE) or AdV-CMV-GFP (GFP) treatment of SH-SY5Y neuroblastoma cells. n = 3/group. (B) SuperExactTest of overlap between genes induced with PGC-1αOE in SH-SY5Y cells compared to genes enriched in either PV-INs or PNs (Mo et al., 2015). (C) SuperExactTest of overlap between genes induced with PGC-1αOE in SH-SY5Y cells with those enriched in eight distinct GABAergic subclusters. (D) WebGestalt enrichment analysis of consensus binding sites in the promoters of identified transcripts upregulated by PGC-1α overexpression. There was an overlap of 627 genes between these RNA sequencing data and previously published microarray data (Lucas et al., 2014). WebGestalt enrichment analysis for these overlapping genes are shown. (E) Ppargc1a and Pvalb transcript in samples treated with DMSO and either AdV-CMV-Ppargc1a-ires-GFP (PGC-1αOE) or AdV-CMV-GFP (GFP) to confirm overexpression. (F) Previously identified PGC-1α-responsive transcripts in the DMSO and PGC-1αOE as fold control. *p ≤ 0.05, @p ≤ 0.001, $p ≤ 0.0001.
