
Figure 2. Inverse agonist of ERRα attenuates the induction of PGC-1α-responsive transcripts.
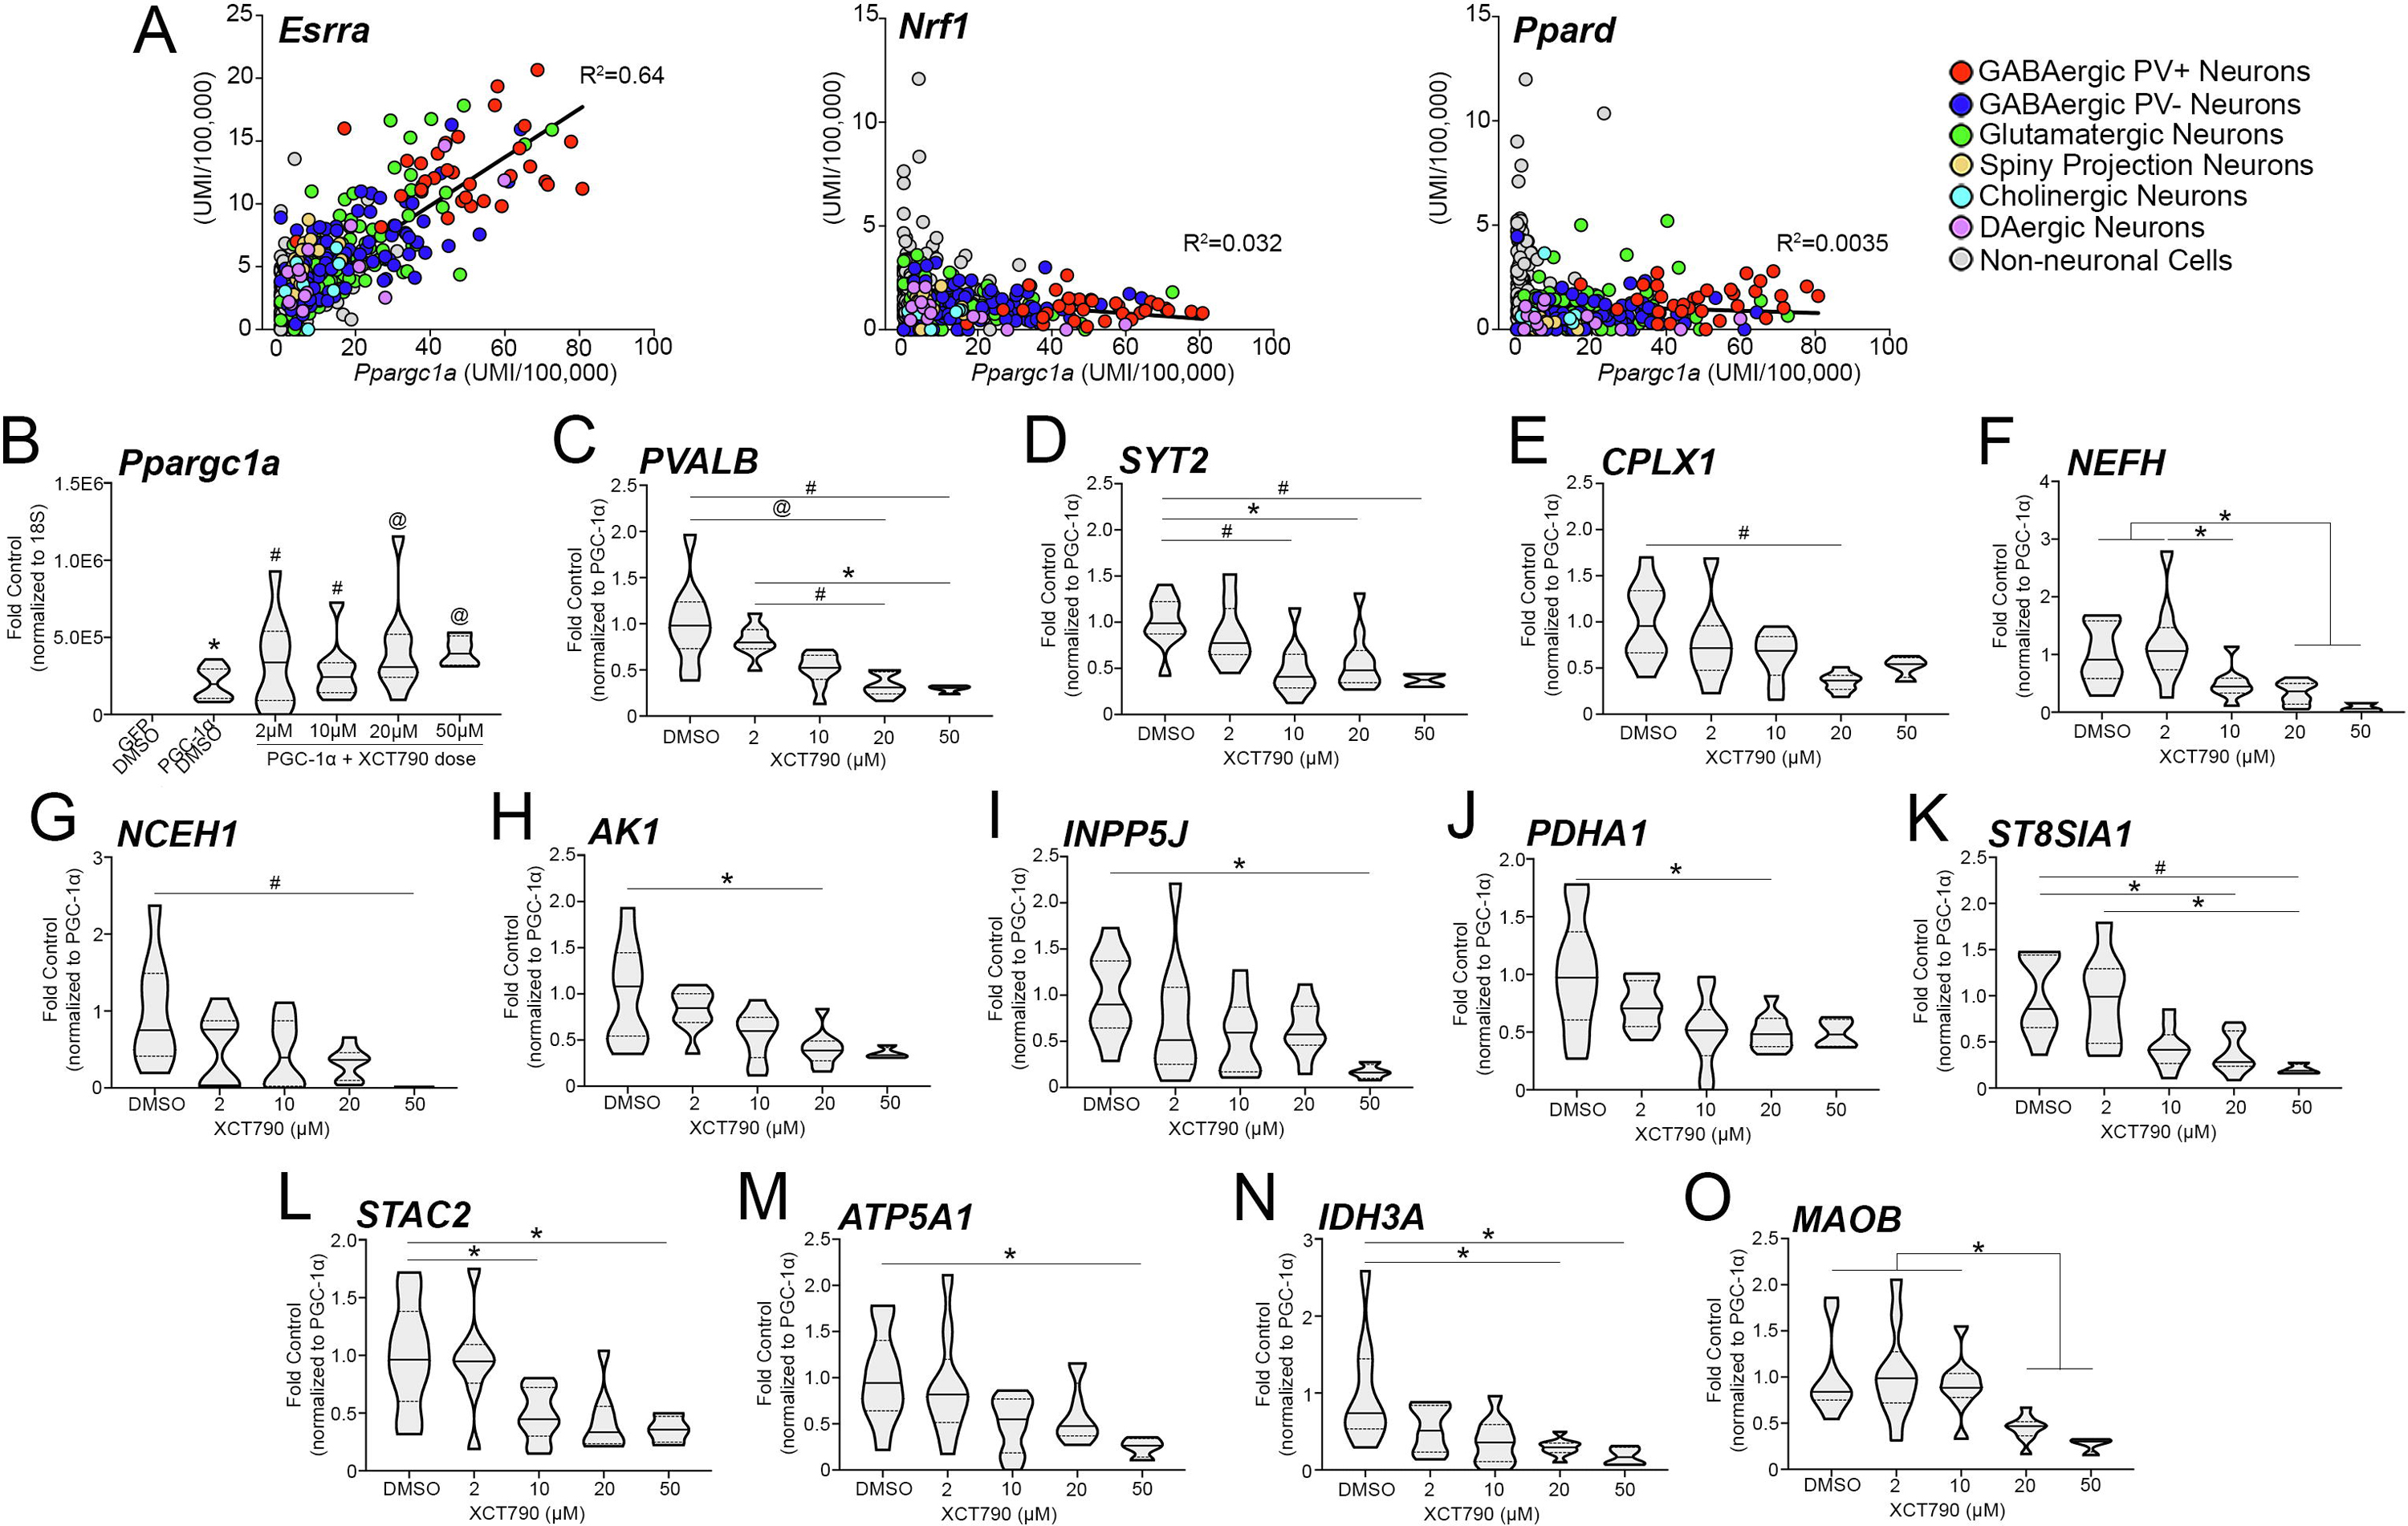
(A) Correlation of Esrra, Nrf1, and Ppard transcript abundance across neuronal and non-neuronal populations throughout the brain with that of Ppargc1a (Dropviz.org; n=231 non-neuronal, n=152 glutamatergic, n=88 PV− GABAergic, n=33 PV+ GABAergic, n=16 medium spiny neuron, n=7+ cholinergic, n=13 DAergic). (B) Significantly increased Ppargc1a transcript levels in DMSO and XCT790-treated SH-SY5Ys following PGC-1αOE compared with samples treated with DMSO and AdV-CMV-GFP. (C-F) Transcript for neuronally enriched genes PVALB, SYT2, CPLX1, and NEFH in the presence of both PGC-1αOE and increasing dose of XCT790. The expression of ubiquitous (G-M) and previously demonstrated direct targets of ERRα (N, O) was also measured. DMSO, n=8–10; 2 μM, n=8–10; 10 μM, n=8–10; 20 μM, n=8–10; 50 μM, n=3–4 XCT790. *p≤0.05, #p≤0.01, @p≤0.001, $p≤0.0001. Median is represented by the solid line, upper and lower quartiles are represented by dotted lines.