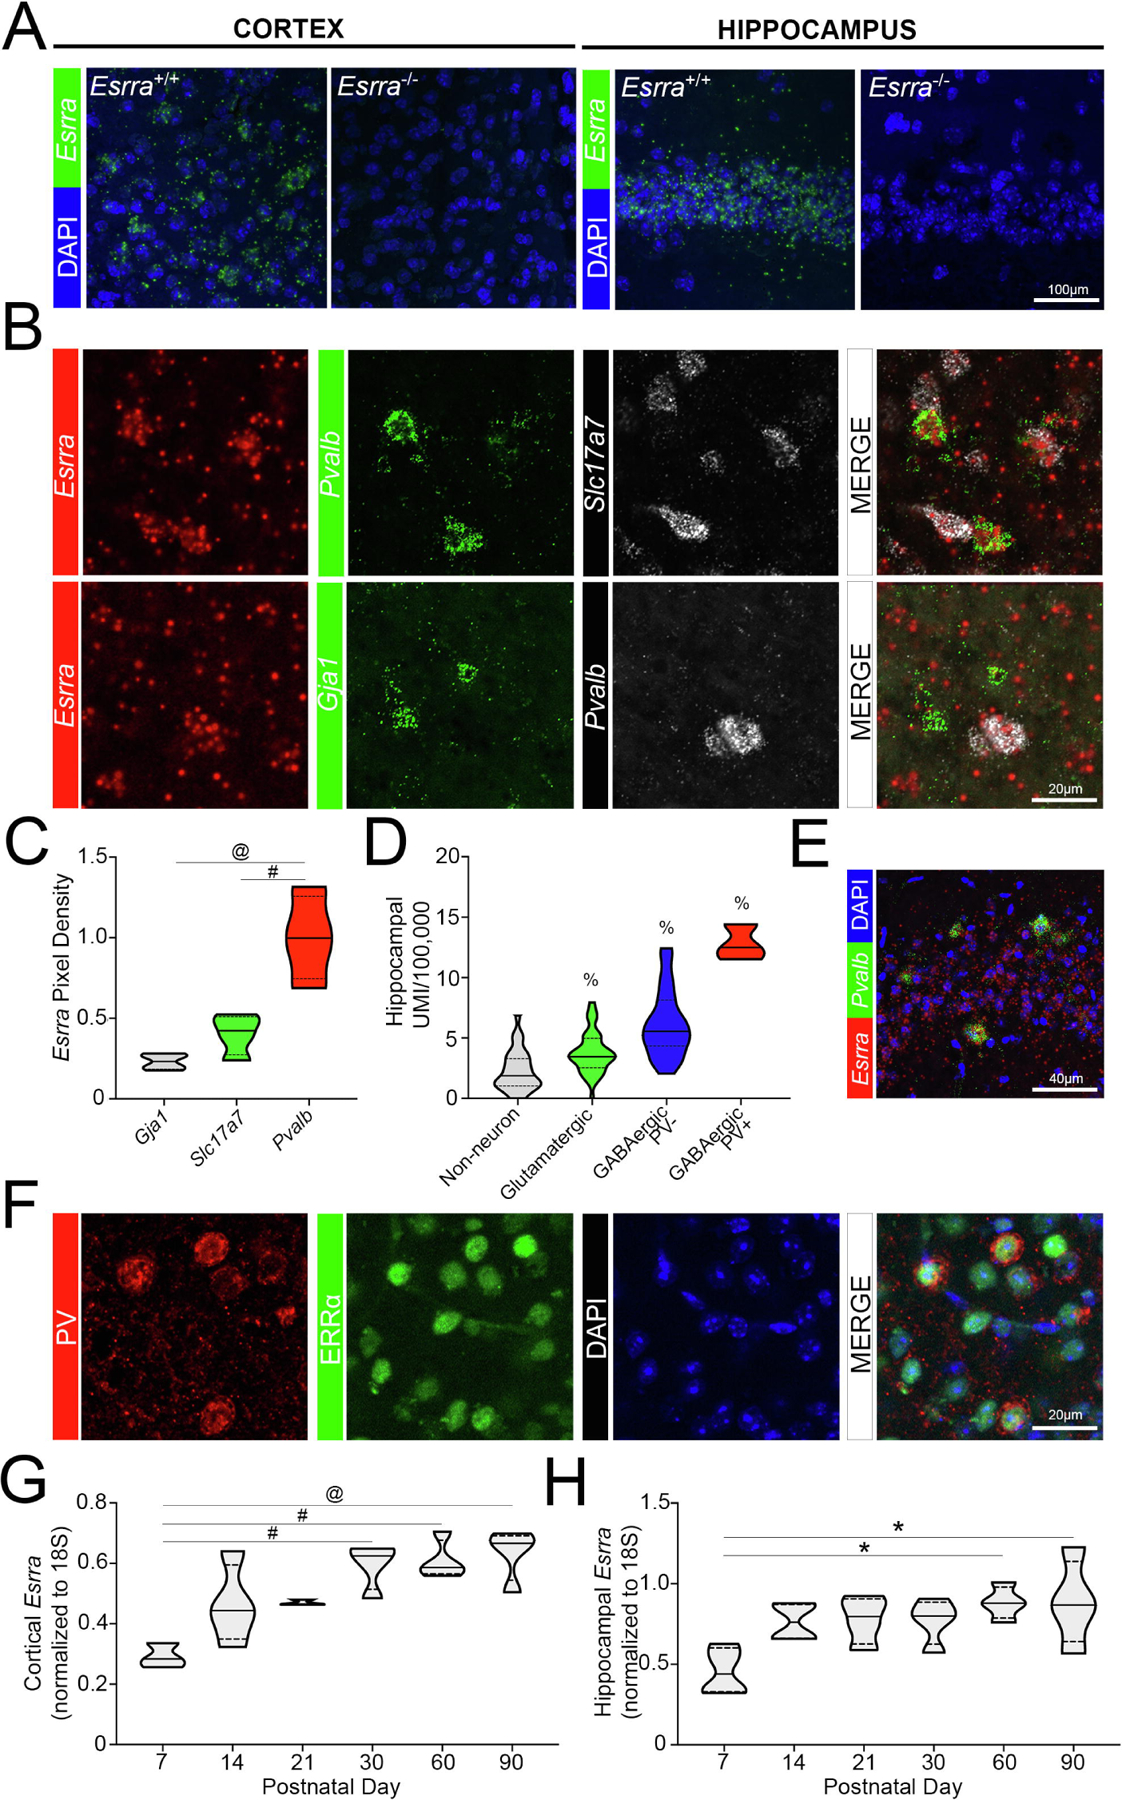
Figure 3. Enrichment of Esrra in parvalbumin-expressing neuronal populations.

(A) Validation of SM-FISH probe in Esrra+/+ and Esrra−/− cortex and hippocampus (n=2 sections/mouse; 2 mice/genotype). (B) Distribution of Esrra transcript using SM-FISH in Pvalb+, Slc17a7+, and Gja1+ populations in the cortex of wildtype mice (n=3 sections/mouse, 2 images/section, n=4 mice; n=1147–2006 Slc17a7+ cells/mouse, n=42–130 Pvalb+ cells/mouse, n=60–149 Gja1+ cells/mouse). These data are quantified in (C) using ImageJ. (D) Localization data of Esrra obtained from Dropviz.org for hippocampus (n=3 PV+ GABAergic neurons, n=23 PV− GABAergic neurons, n=43 glutamatergic neurons, n=32 non-neuronal cells) and (E) represented by SM-FISH in wildtype (n=3 sections/mouse, 3 mice). (F) Confocal microscopy showing colocalization of ERRα protein and PV in murine cortex (n=3 mice). (G, H) Expression of Esrra in the wildtype cortex and hippocampus across age (n=3–4/group). *p≤0.05, #p≤0.01, @p≤0.001, $p≤0.0001, % indicates a significant difference from all other groups. Median is represented by the solid line, upper and lower quartiles are represented by dotted lines.
