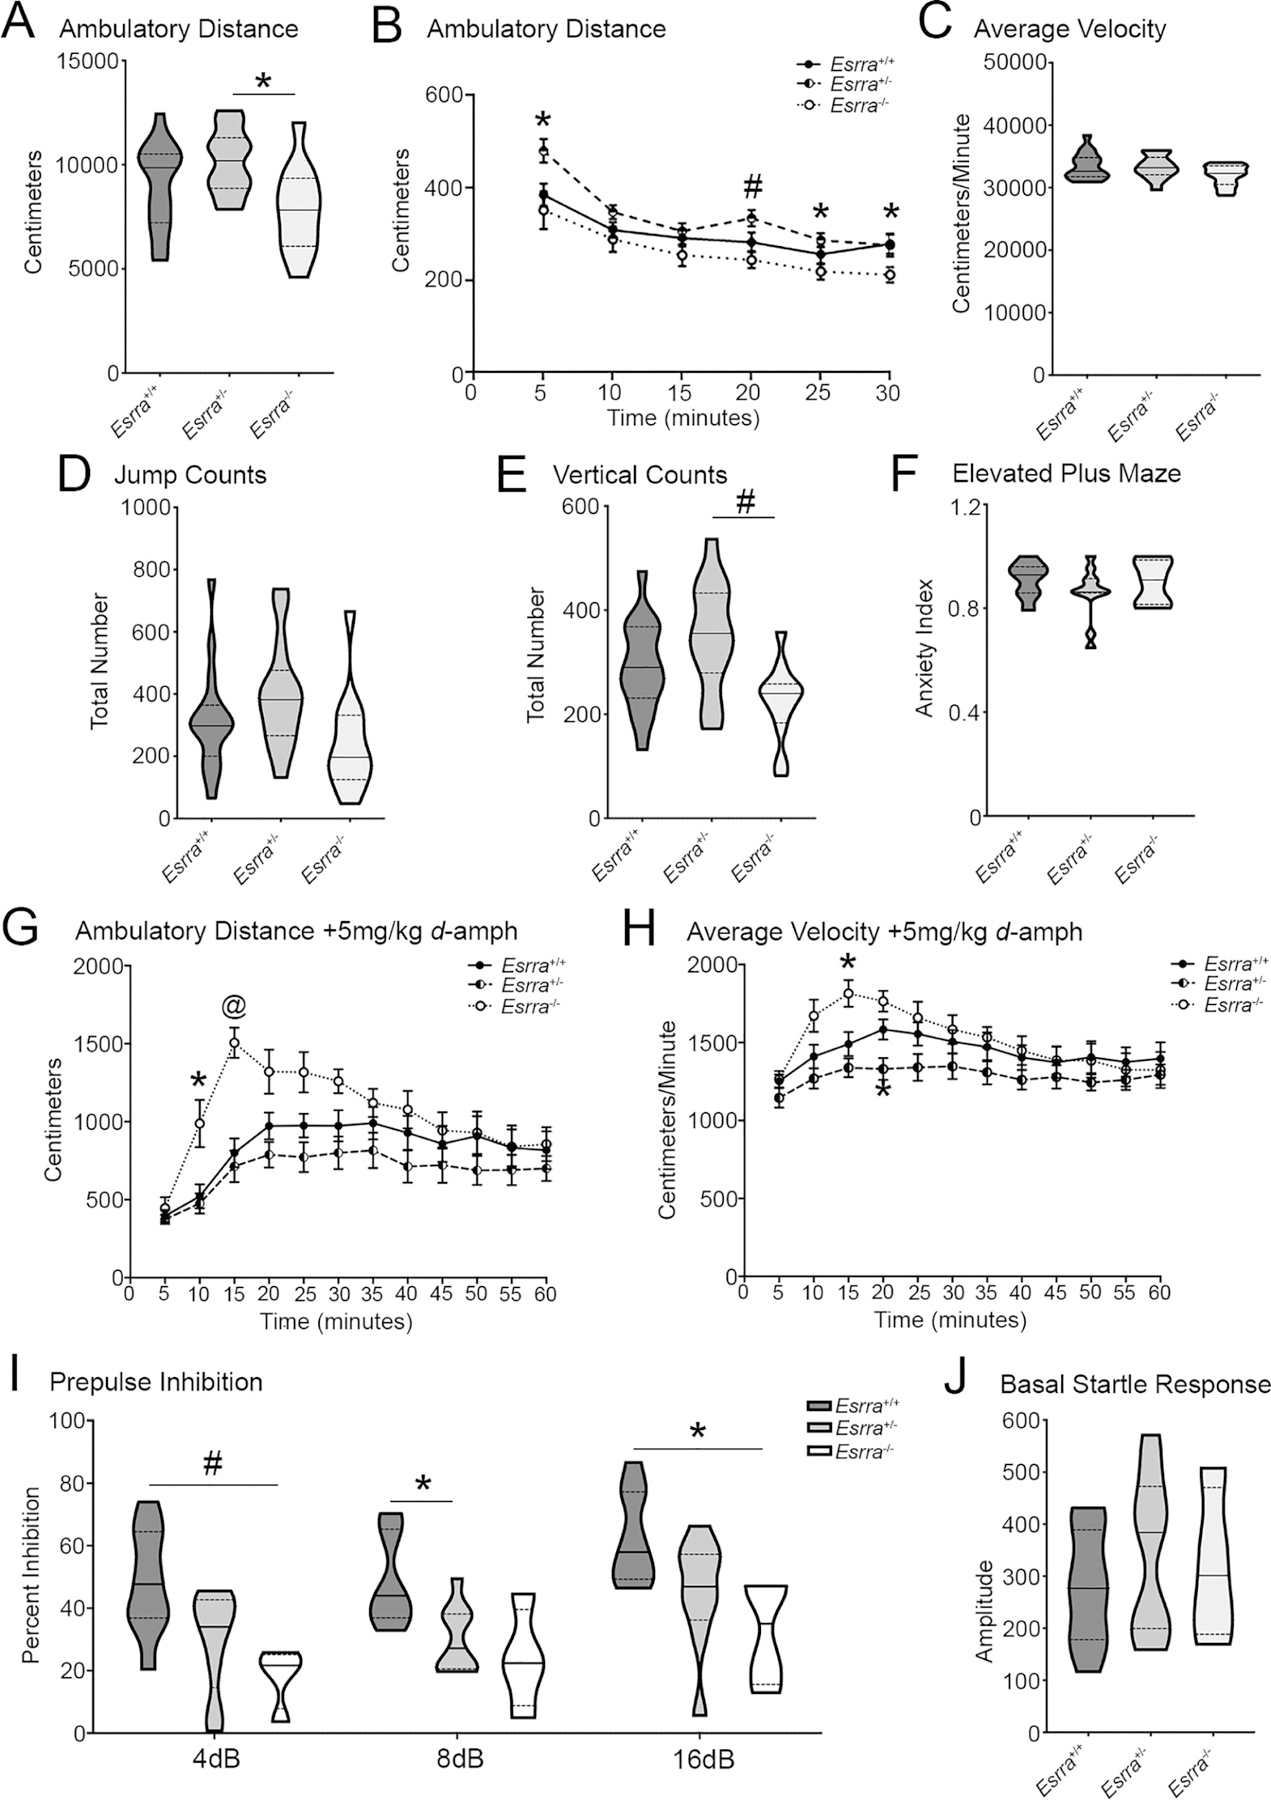
Figure 6. ERRα null mice show hyperactivity in response to amphetamine and deficits in sensory motor gating.

(A) Overall ambulatory distance and (B) across time, (C) average velocity, (D) jump counts, (E) and vertical counts in open field for Esrra+/+, Esrra+/−, and Esrra−/− mice. (n=17 Esrra+/+, n=14 Esrra+/−, n=12 Esrra−/−). (F) Anxiety index in elevated plus maze. (n=8 Esrra+/+, n=11 Esrra+/−, n=5 Esrra−/−). (G) Ambulatory distance and (H) average velocity in open field following intraperitoneal injection of 5mg/kg d-amphetamine. (n=10 Esrra+/+, n=9 Esrra+/−, n=7 Esrra−/−). (I) Prepulse inhibition (N=4–9/genotype) and (J) baseline startle response (n=9 Esrra+/+, n=9 Esrra+/−, n=4 Esrra−/−). (K, L) Maoa and Maob transcript in cortex, hippocampus, striatum, midbrain and cerebellum. (see previous regional data for samples sizes). *p≤0.05, #p≤0.01, @p≤0.001. Violin plots show median represented by the solid line, upper and lower quartiles are represented by dotted lines. Line graphs show mean ± SEM.
