Fig. 1.

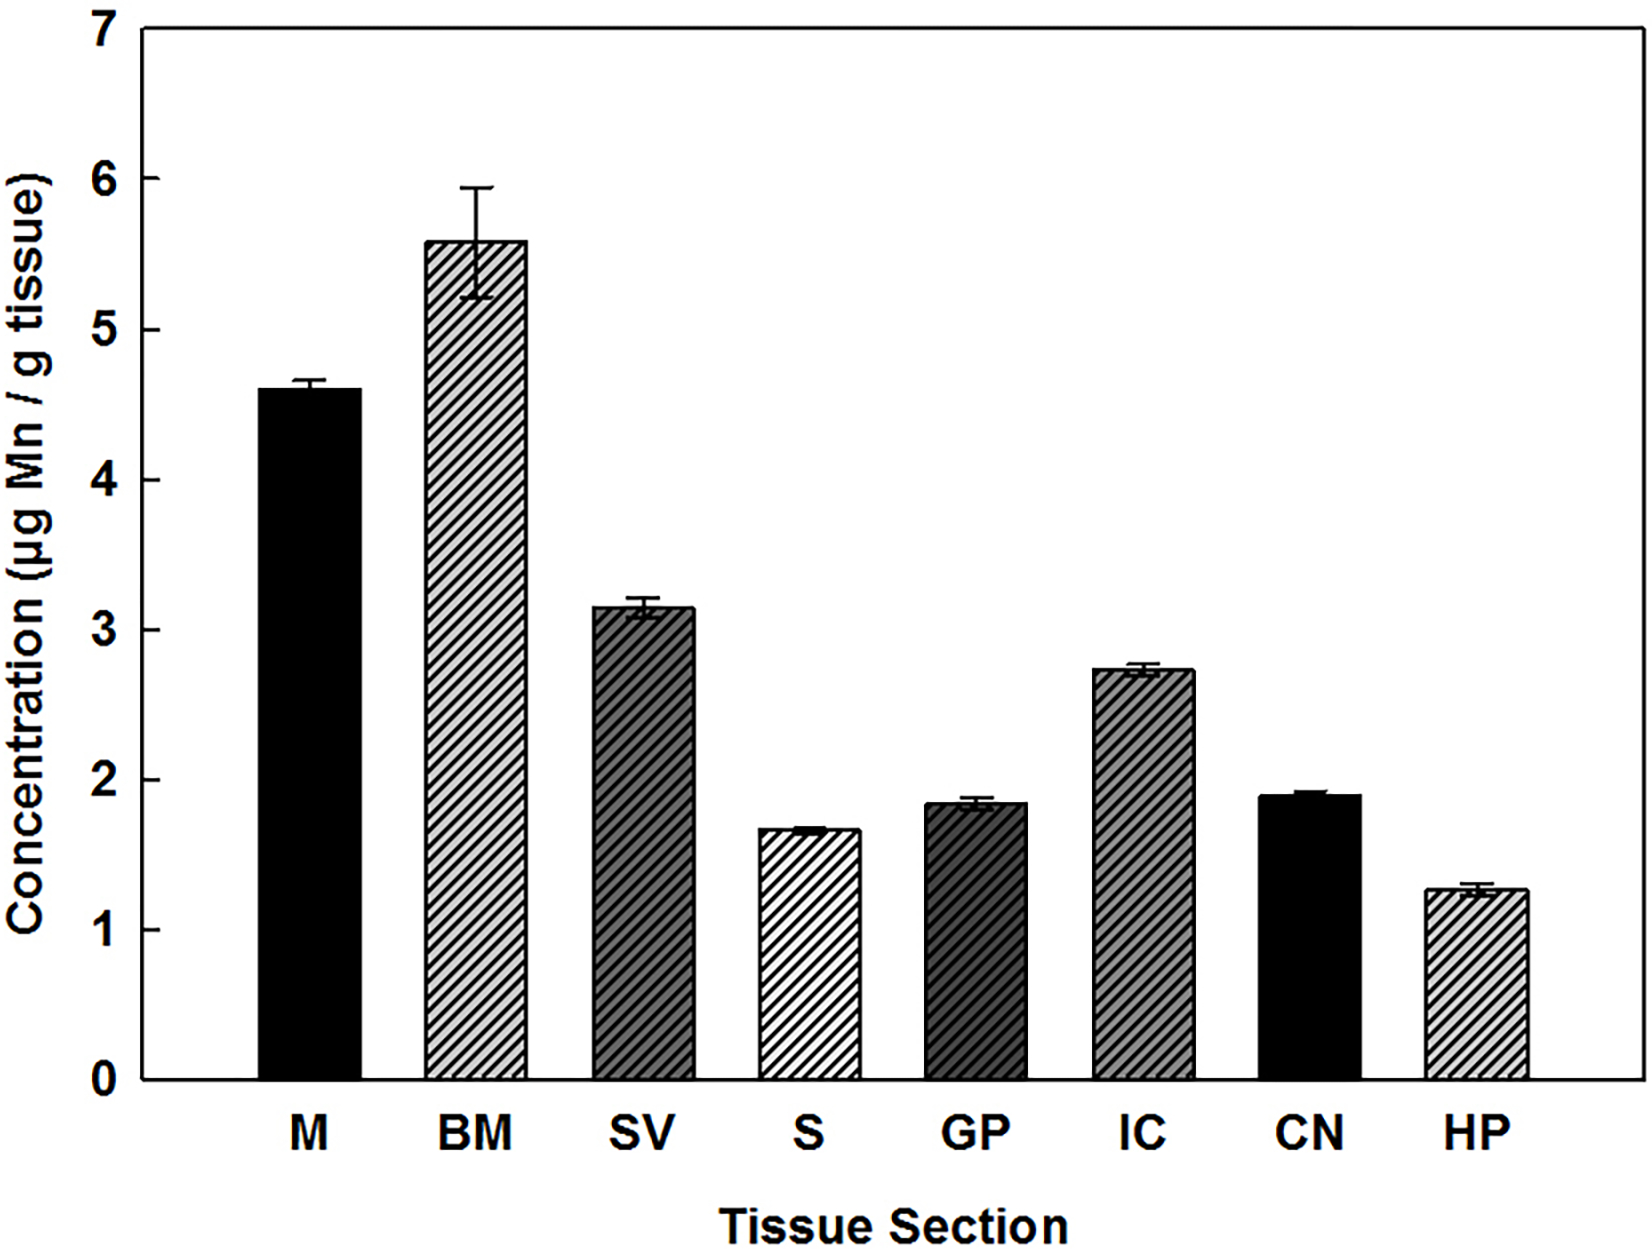
Mn concentrations (μg/g) present in the cochlea: M, BM, SV, and brain: S, GP, IC, CN, and HP of rats. Error bars represent standard error (n = 9). g of tissue are expressed as dry weight.

Mn concentrations (μg/g) present in the cochlea: M, BM, SV, and brain: S, GP, IC, CN, and HP of rats. Error bars represent standard error (n = 9). g of tissue are expressed as dry weight.