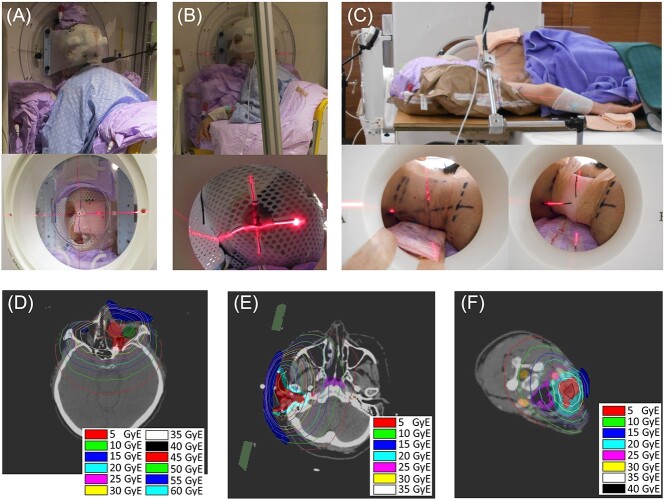
Fig. 3.
Patient setup and tumor dose distributions for representative cases. A, B and C showed pictures of the patient setup during treatment for representative cases of FF, FL and N groups, respectively. The patients were set up in the position determined during the preliminary patient set up and treatment planning, aligned with the center of the beam axis (laser intersection) as in the treatment plan. Tumor dose distributions for each patient according to the treatment plan are depicted in D, E and F for each patient in the picture A, B and C, respectively. The red contours in D, E and F represent the GTV, and the surrounding light red contours in D and the light blue contours in E and F represent the CTV. Note that each tumor dose distribution applies only to the evaluation of GTV and CTV dose. The blue contours represent water-equivalent boluses to increase the dose of body surface. Abbreviations: FL, face/lateral; FF, face/front; N, neck; GTV, gross tumor volume; CTV, clinical targe volume.

