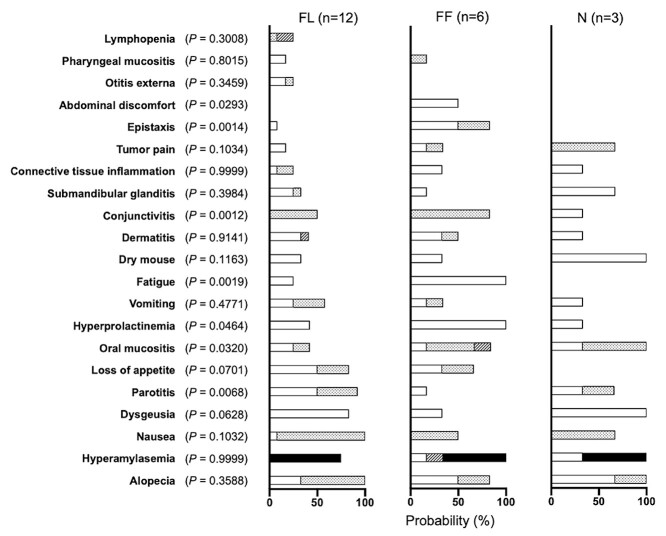
Fig. 4.
Relationship between beam incidence position and propensity for adverse events. Frequency of adverse events in the FL, FF and N groups. White, dotted, striped and black bars represent the probability of Grade 1, 2, 3 and 4 adverse events, respectively. Abbreviations: FL, face/lateral; FF, face/front; N, neck.

