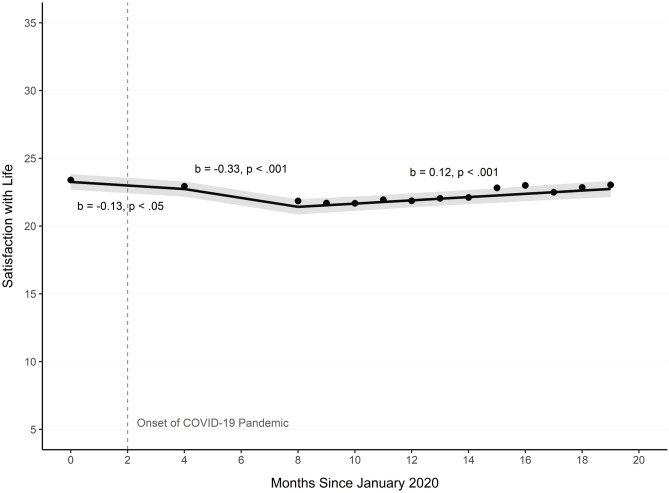
Fig. 4.
Observed means for satisfaction with life at each timepoint (points) and model-predicted means estimated from spline growth models (line). In the spline growth plots, confidence bands represent 95% confidence interval and significant spline slopes are indicated with the slope labels. Segments without slope labels are non-significant (i.e., p > .05)

