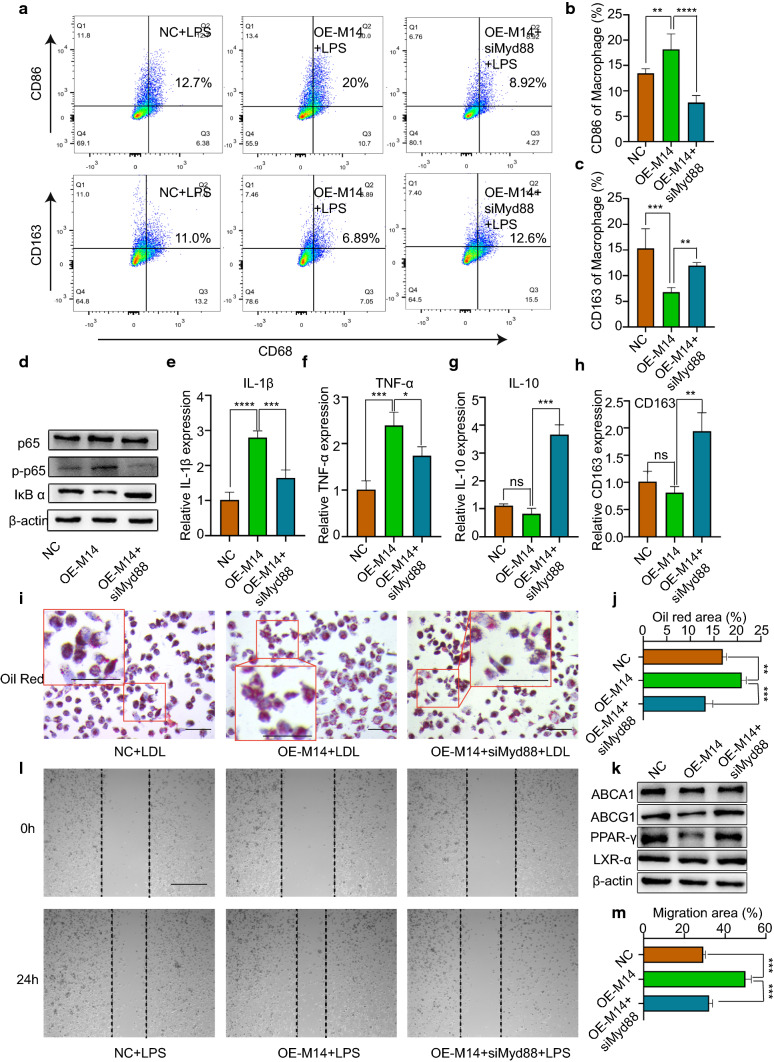
Fig. 5.
Mettl14 regulates the inflammatory response of macrophages through Myd88. a–h and l–m THP-1 cells were transfected with NC, OE Mettl14 or OE Mettl14 and siMyd88 before treatment with LPS (500 ng/ml). a–c The percentage of M1 polarization (CD68+CD86+) and M2 polarization (CD68+CD163+) was determined by flow cytometry. n = 4 per group. The data are expressed as the means ± SDs. P values were determined by one-way ANOVA with Fisher’s LSD post hoc test. **P < 0.01; ***P < 0.001; ****P < 0.0001. d The proteins p65, p-p65 and IκB α were measured by western blotting. The mRNA levels of IL-1β (e), TNF-α (f), IL-10 (g) and CD163 (h) were analyzed by qRT-PCR. n = 3 per group. The data are expressed as the means ± SDs. P values were determined by one-way ANOVA with Fisher’s LSD post hoc test. *P < 0.05; **P < 0.01; ***P < 0.001; ****P < 0.0001; ns, not significant. i–k THP-1 cells were transfected with NC, siM14-1, or siM14-2 before treatment with LDL (50 μg/ml). i, j Foam cell formation was detected by oil red O staining. Scale bar = 100 μm. n = 3 per group. The data are expressed as the means ± SDs. P values were determined by one-way ANOVA with Fisher’s LSD post hoc test. **P < 0.01; ***P < 0.001. k The ABCA1, ABCG1, PPAR-γ, and LXR-α protein levels were measured by western blotting. l, m Macrophage migration was assessed by wound healing assays. Scale bar = 200 μm. n = 3 per group. The data are expressed as the means ± SDs. P values were determined by one-way ANOVA with Fisher’s LSD post hoc test. ***P < 0.001

