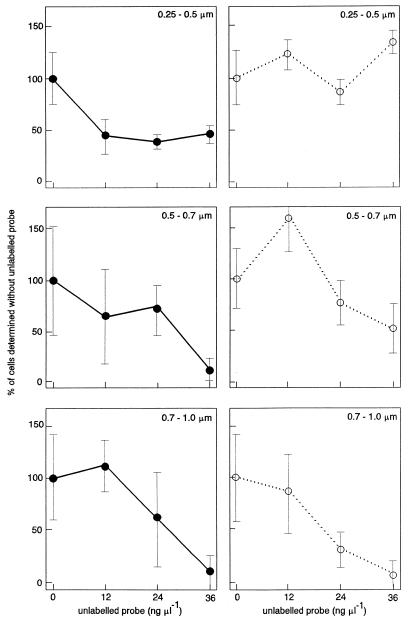
FIG. 3.
Numbers of cells in size groups (0.25 to 0.5, 0.5 to 0.7, and 0.7 to 1.0 μm) targeted with specific probe EUB338 (●) or nonspecific probe NONEUB338 (○) in the presence of different concentrations of the corresponding unlabelled probes. The number of cells obtained without unlabelled probes was defined as 100%. The bars indicate standard deviations (n = 3).

