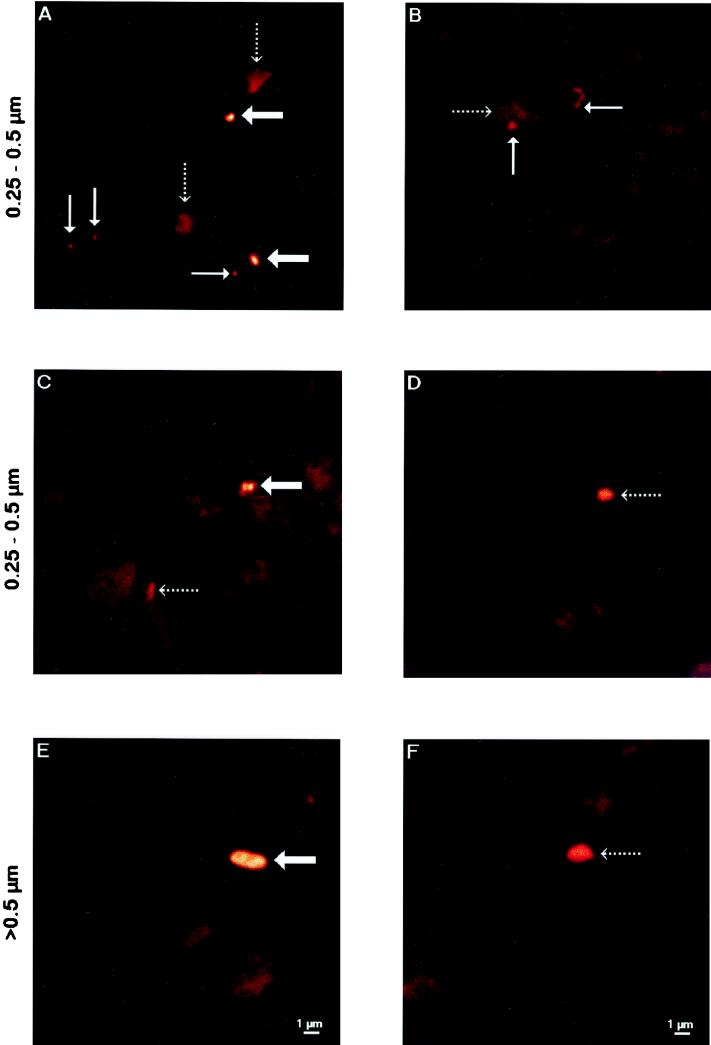
FIG. 4.
CLSM images of active bacteria (broad arrows), nonactive bacteria (thin arrows), and nonbacterial soil particles (dotted arrows) preselected randomly by conventional microscopy following in situ slurry hybridization (EUB338 probe). Active and nonactive bacteria representing different size classes (0.25 to 0.5 μm [A through D] and 0.5 to 0.7 μm [E and F]) are shown. The size bars in panels E and F apply to all images.

