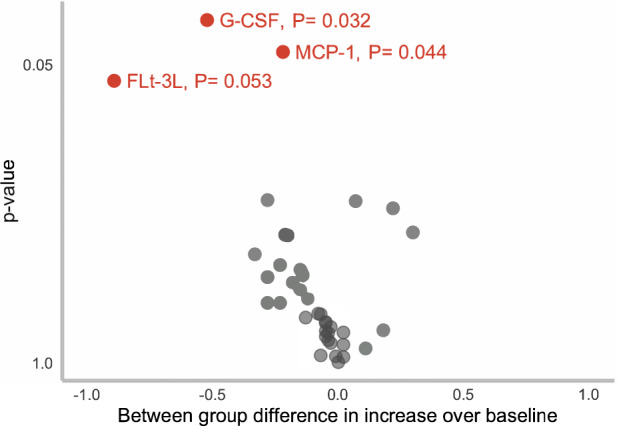
Fig. 4. Analysis of cytokine data.

Volcano plot showing the difference in increase in expression levels of granulocyte colony-stimulating factor (G-CSF), monocyte chemoattractant protein (MCP-1) and FMS-like tyrosine kinase-3 ligand (Flt-3 ligand) from baseline between the yoga group and the control group granulocyte colony-stimulating factor [0.55 (0.05–1.05), p = 0.03], monocyte chemoattractant protein [0.22 (0.01–0.43), p = 0.04], and FMS-like tyrosine kinase-3 ligand.
