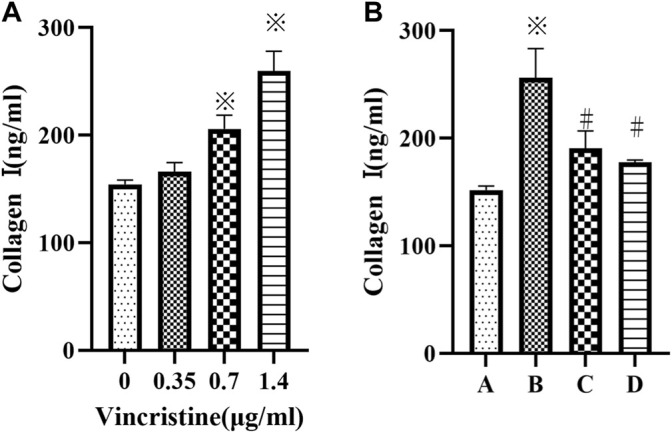
FIGURE 2.

(A): Cells were treated with different concentration of vincristine (0, 0.35, 0.7 and 1.4 μg/ml) for 24 h *p < 0.05 vs. the control group. (B): VCR-induced collagen I production was decreased by SB203580 and PD98059 (cells were treated with 1.4 μg/ml VCR for 24 h). We measured the level of collagen I using ELISA assay. *p < 0.05 vs. the control group; #p < 0.05 vs. the VCR group. A: control group, B VCR group, C: SB203580 group, D: PD98059 group.
