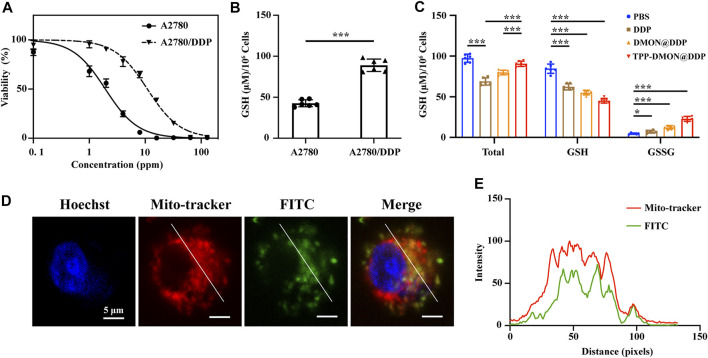
FIGURE 4.
The resistant characteristic of A2780/DDP cells and mitochondria-targeting delivery. (A) Cell viability of A2780 and A2780/DDP cells after incubation with DDP. (B) Intracellular GSH content in A2780 and A2780/DDP cells (*p < 0.05, **p < 0.01, ***p < 0.001, n = 6). (C) Intracellular GSH content in A2780/DDP cells after treatment with PBS, DDP, DMON@DDP, and TPP-DMON@DDP (*p < 0.05, **p < 0.01, ***p < 0.001, n = 6). (D) Distribution of TPP-DMON@DDP in A2780/DDP cells detected by CLSM with Hoechst (blue), MitoTracker (red), and FITC-labeled TPP-DMON@DDP (green). Scale bar = 5 μm. (E) Co-localization analysis using ImageJ.

