FIGURE 2.
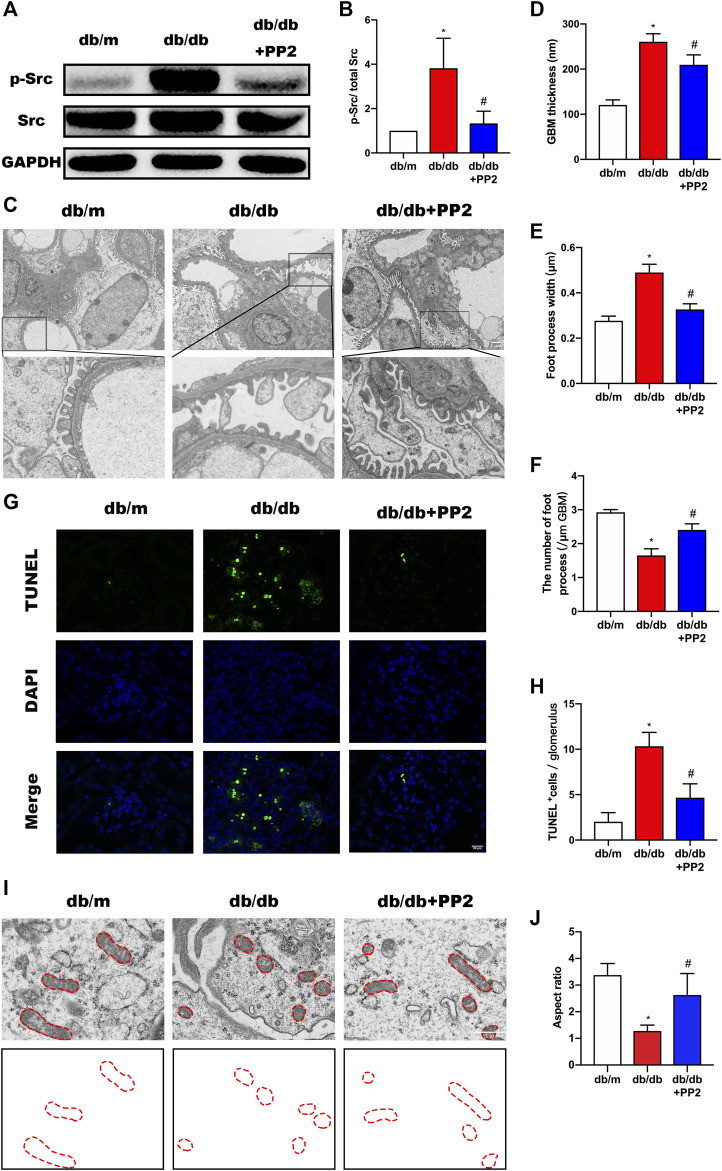
Inhibition of Src activity ameliorates podocyte injury. (A) Representative Western blot images of Src and p-Src levels in kidney tissues from the different treatment groups. (B) Quantification of expression levels of Src and p-Src; GAPDH was used as the loading control. (C) Representative transmission electron micrographs showing changes in podocyte in the kidneys of the different groups. (Magnification, 3000 ×). (D–F) Quantitation of the thickness of the glomerular basement membrane (GBM), foot process widths and number of foot processes/µm. (G) TUNEL assays evaluating cell apoptosis in glomeruli among the different groups. TUNEL-positive (apoptotic) cells are stained green, and nuclei labeled with DAPI (blue). (Magnification, 400 ×). (H) Quantitative calculation of number of TUNEL-positive cells in each glomerulus. (I) Representative electron micrographs of mitochondrial ultrastructure in podocytes from each treatment group. (Magnification, 12,000 ×), (J) Quantitative calculation mitochondrial aspect ratio in each group. Values are expressed as the mean ± SD, * p < 0.05 vs. db/m group; # p < 0.05 vs. db/db group. n = 5.

