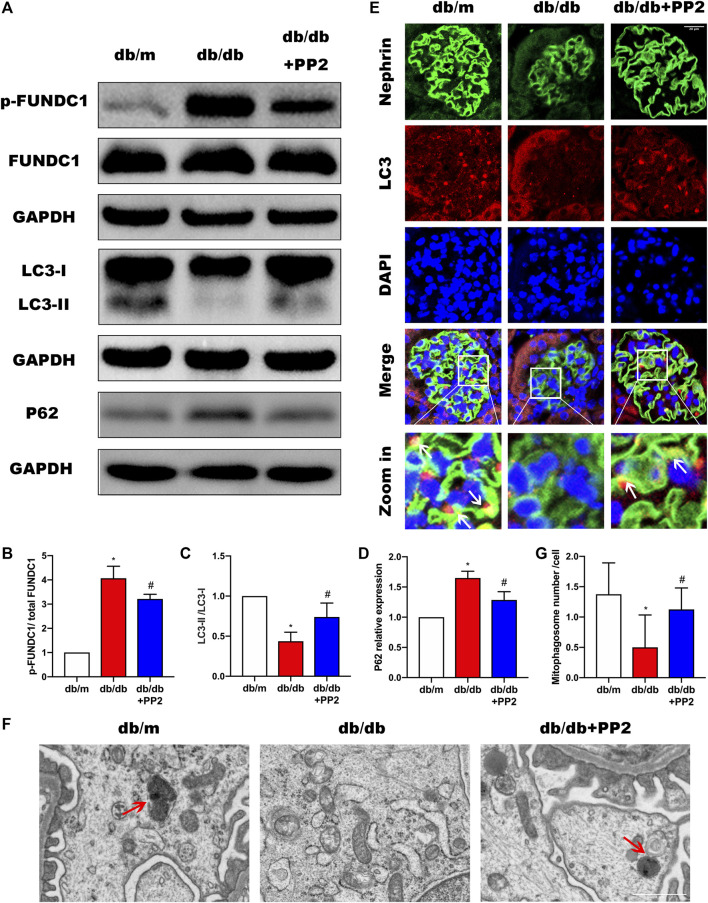
FIGURE 3.
Inhibition of Src activity increases mitophagy during DN. (A) The expression levels of FUNDC1, p-FUNDC1, LC3, P62 in kidney tissues from the different groups were analyzed by Western blot. (B–D) Quantitative analysis of gray values of bands from Western blots, GAPDH was used as loading control. (E) Representative images of LC3 (red) staining in glomeruli in kidney tissues from the different groups. Podocytes were marked by Nephrin staining (green). (Magnification, 600 ×). (F) Representative TEM images demonstrating mitophagosomes (mitophagosomes engulfing mitochondria) in podocytes from the different groups. Red arrows denote typical mitophagosomes. (Magnification, 5000 ×). (G) Quantification of mitophagosomes numbers from the experiment in (F). Values are expressed as the mean ± SD, * p < 0.05 vs. db/m group; # p < 0.05 vs. db/db group. n = 5.

