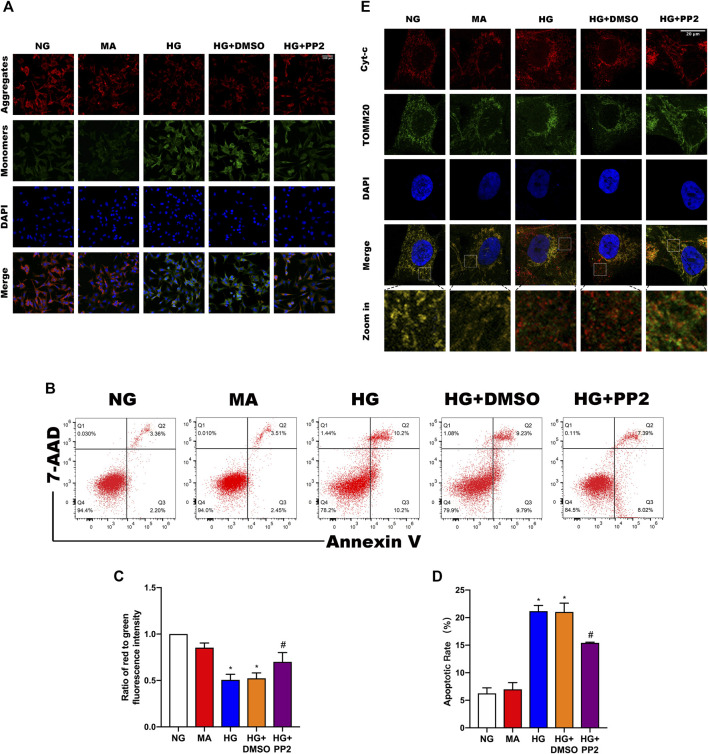
FIGURE 5.
Src activation is related to podocyte mitochondrial apoptosis. (A) JC-1 staining to observe mitochondrial membrane potential changes in podocytes after the indicated treatments. Red fluorescence represents normal, functioning mitochondria while green fluorescence indicates collapsed mitochondrial membrane potential. (Magnification, 200 ×). (B) Flow cytometric detection of podocyte apoptosis rates. (C) MMP measured as the ratio of red to green fluorescence intensity from (A). (D) Quantitation of podocyte apoptosis from (B). (E) Double immunofluorescence labeling of Cyt-c (red) and TOMM20 (green) in podocytes, nuclei labeled with DAPI (blue) (Magnification, 1000 ×). Values are expressed as the mean ± SD, *p < 0.05 vs. NG group, # p < 0.05 vs. HG group.

