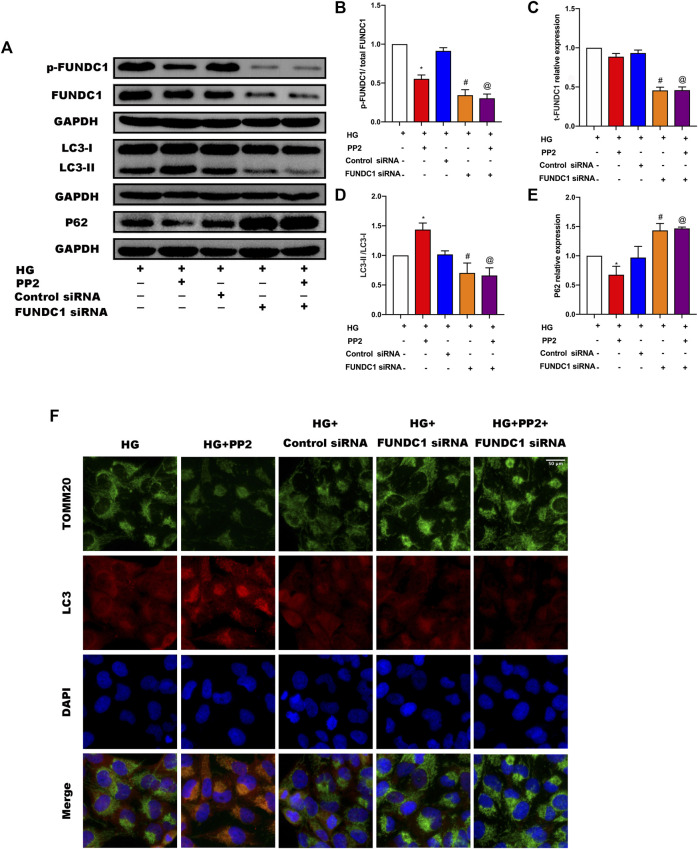
FIGURE 6.
Silencing of FUNDC1 in podocytes suppressed the mitophagy induced by PP2. (A) Representative Western blot images of FUNDC1, p-FUNDC, LC3, and P62 expression in podocytes after the indicated treatments. (B–E) Quantification of Western blot band intensities of the different proteins; GAPDH was used as loading control. (F) Double immunofluorescence staining of LC3 (red) and TOMM20 (green) in podocytes after the indicated treatments (Magnification, 400 ×). Values are expressed as the mean ± SD, *p < 0.05 vs. HG group, # p < 0.05 vs. HG + Control siRNA group, @ p < 0.05 vs. HG + PP2 group.

