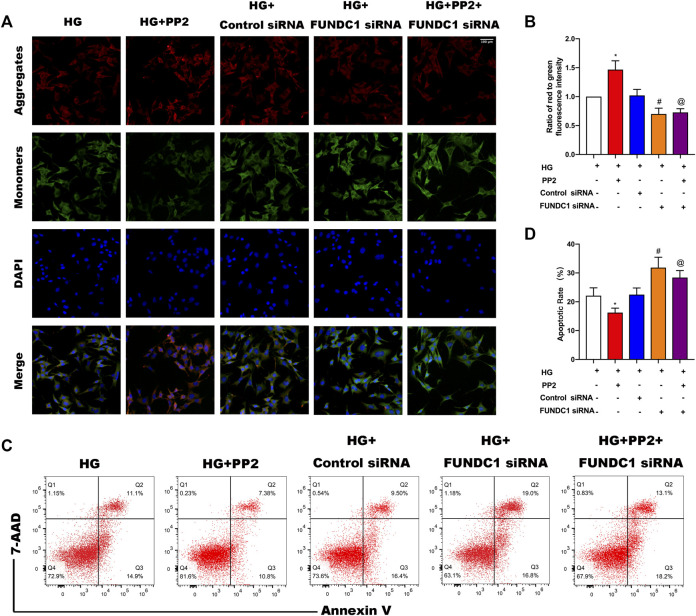
FIGURE 7.
Silencing of FUNDC1 eliminates the protective effects of PP2 on podocytes exposed to HG conditions. (A) JC-1 staining to detect MMP. (Magnification, 200 ×). (B) MMP measured as the ratio of red to green fluorescence intensity from (A). (C) Flow cytometry analysis of apoptosis in podocytes after the indicated treatments. (D) Quantitation of podocyte apoptosis from (C). Values are expressed as the mean ± SD, *p < 0.05 vs. HG group, # p < 0.05 vs. HG + Control siRNA group, @ p < 0.05 vs. HG + PP2 group.

