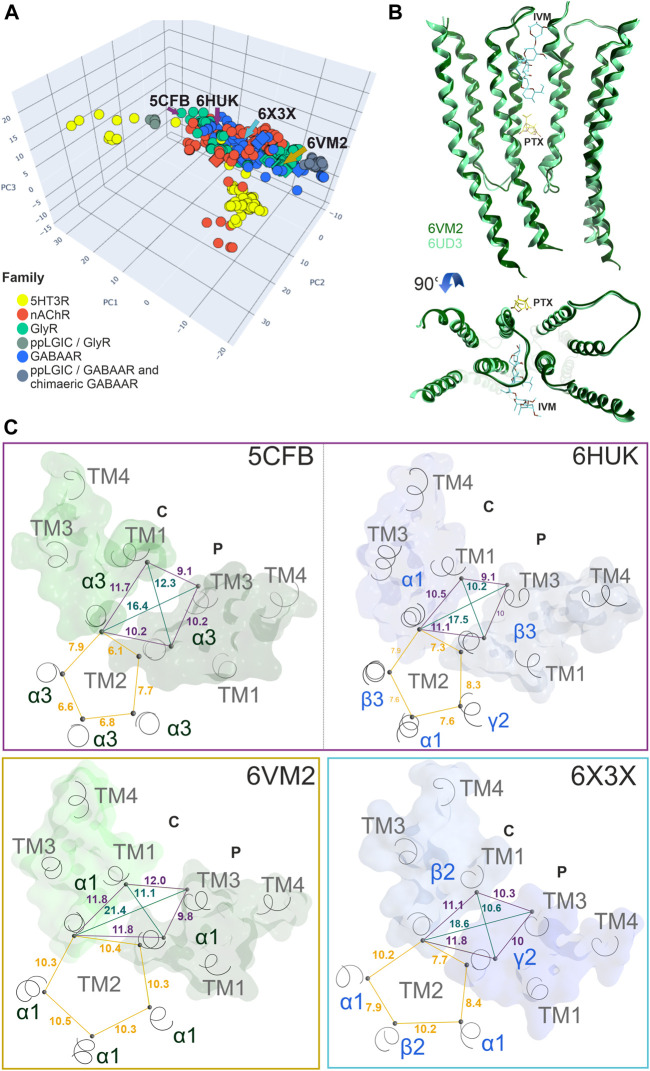
FIGURE 5.
Conformation analysis of the upper TMD interface pocket: (A) Scatter plot of the pocket conformations. Each dot represents the results for an individual upper TMD interface, diamond shaped symbols indicate the presence of a ligand in the analysed site. The colour of the dots indicates the protein family as defined in the legend, gray is used for diverse chimeras. ppLGIC: procaryotic pentameric ligand gated ion channel. Arrows and PDB IDs indicate the localization of structures which are rendered in panels (B) and (C), arrow and box colours match across the panels. (B) Superposition and comparison of two interface forming subunits of the ivermectin bound Gly R structure 6VM2 and the picrotoxin bound 6UD3, featuring nearly identical conformations of the entire TMD. (C) Different conformations result in different distances between alpha carbon atoms: A plane through the upper TMD is depicted with all five TM2 segments and two subunits. Distances between alpha carbons are shown to illustrate backbone conformation, where yellow lines are distances between homologous pore forming TM2 residues as an indication for asymmetry, purple lines are distances between pocket forming residues defining the circumference, and green lines the pocket “diagonals”.

