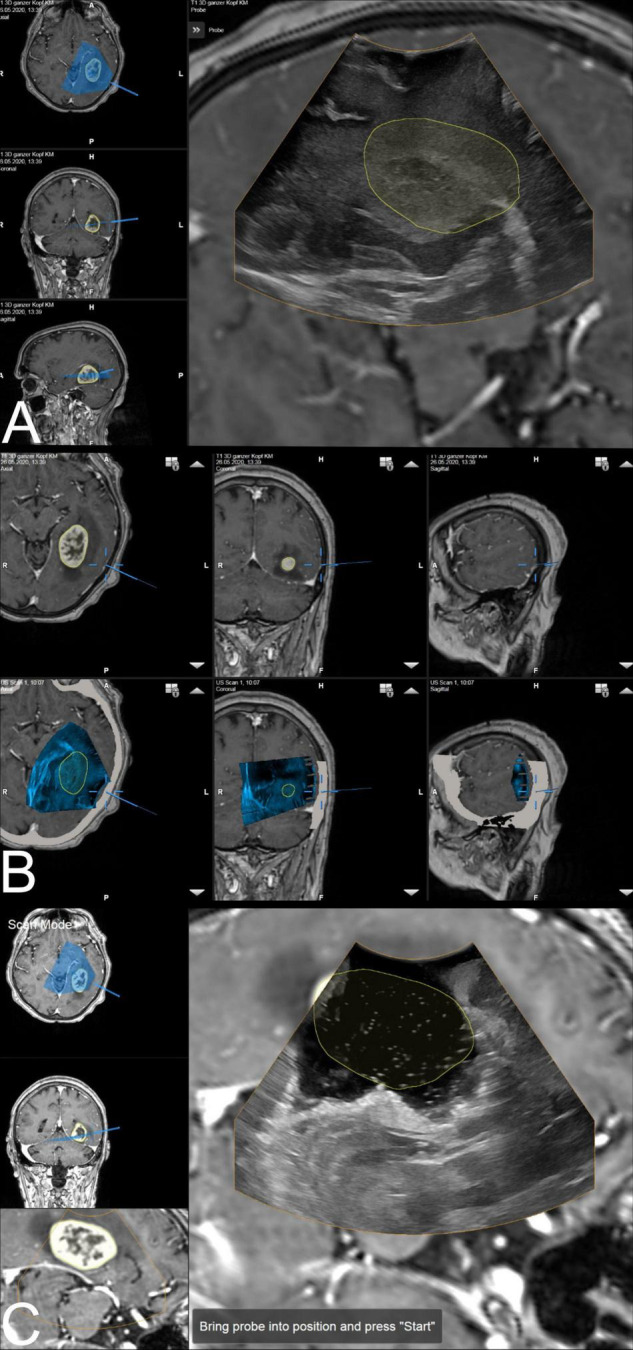
FIGURE 1.

The ultrasound application: intraoperative display of i3D US over MRI data. (A) The first intraoperative ultrasound before dural opening is displayed as an overlay. The yellow line shows the tumor borders segmented on pre-MRI, which are not correspondent with i3D US, indicating brain deformation. Corresponding axial, coronal, and sagittal view of pre-MRI data is shown on the left side, including a visualization of localization and orientation of the recent i3D US. (B) After i3D US acquisition, the ultrasound application automatically displays pre-operative imaging (upper row: pre-MRI) and intraoperative imaging (lower row: i3D US as an overlay in pre-MRI) simultaneously in an axial, coronal, and sagittal slice depending on the position of the navigated transducer (cursor). Besides this, the arrows on the right side of each view allow for scrolling through the co-registered i3D US and pre-MRI sets to further explore the data. (C) The second navigated intraoperative ultrasound after resection (post-US) is displayed as an overlay on the pre-MRI. Analogous to (A), the tumor outlines based on the pre-MRI data are visualized in yellow demonstrating the tumor boundaries to be completely within the resection cavity. For comparison of live ultrasound images and pre-MRI data, the scan mode view is chosen. In this case, the left-hand side of the image shows the axial and coronal view, as well as the inline view of the pre-MRI dataset, on which the ultrasound data is superimposed, without the overlay.
