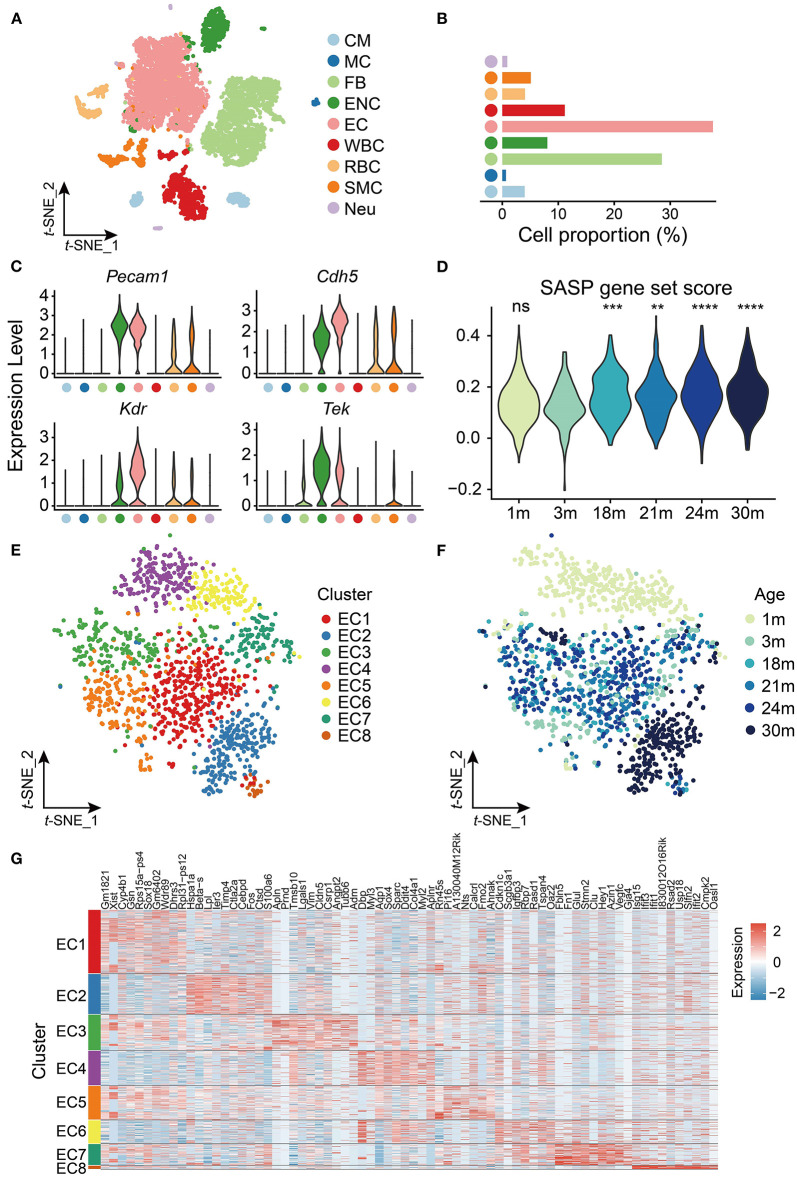
Figure 1.
scRNA-seq analysis of cardiovascular endothelial cells (ECs) during aging. (A) t-SNE plot showing nine cell types from heart and aorta. CM, cardiomyocyte; MC, mast cell; FB, fibroblast; ENC, endocardial cell; EC, endothelial cell; WBC, leukocyte; RBC, erythrocyte; SMC, smooth muscle cell; Neu, cardiac neuron. (B) Bar plot showing cell proportion of nine cell types from heart and aorta. (C) Violin plots showing expression of EC markers in the heart and aorta. (D) Violin plot showing the SASP gene set score is significantly increased with age in ECs. ns, not significant; **p < 0.01; ***p < 0.001; ****p < 0.0001. (E) t-SNE plot showing eight clusters of ECs from heart and aorta. (F) t-SNE plot showing ECs from heart and aorta across the lifespan. (G) Heatmap showing top 10 markers expressed in each cluster of ECs from the heart and aorta.

