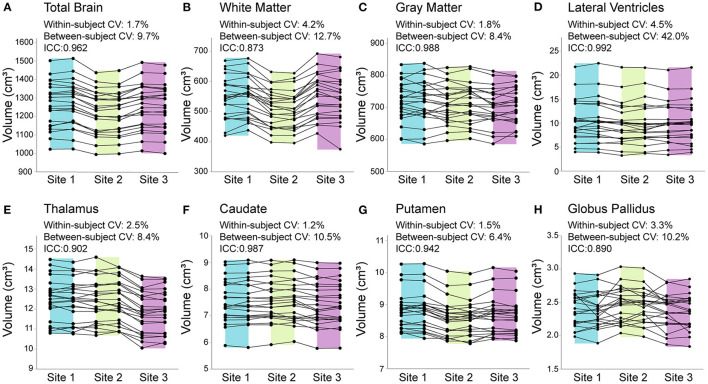
Figure 2.
Total brain (A), white matter (B), gray matter (C), lateral ventricle (D), thalamus (E), caudate (F), putamen (G), and globus pallidus (H) volumes from all 23 traveling phantom participants scanned twice each at each of the 3 sites (138 datapoints per structure total). Percent change in consecutive scans within subject at each site was <1% for all structures (at all sites), except lateral ventricle and white matter volume at Site 3 (FMC), which had 1% and 1.6% difference (respectively) between test–retest scans. Coefficient of variation (CV) within–participants across the 3 sites ranged from 1.2% [(F) caudate] to 4.5% [(D) lateral ventricles], while between–participant CV was much larger for all structures, ranging from 6.4% [(G) putamen] to 42% [(D) lateral ventricles]. Intraclass correlation coefficients (ICCs) suggested excellent agreement between scanners, ranging from 0.873 [(B) white matter] to 0.992 [(D) lateral ventricles]. Shading indicates the range for each site (Site 1/UofA – blue; Site 2/ACH – green; Site 3/FMC – purple).

