FIGURE 2.
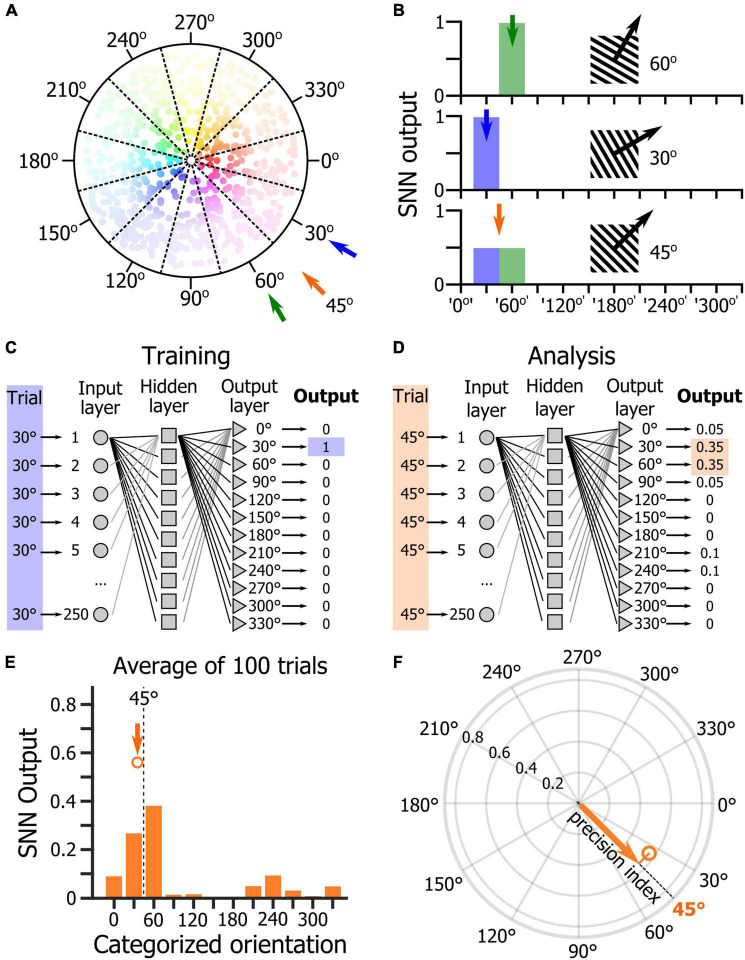
Analysis of orientation representation in V1 using shallow neural networks. (A) Schematic representation of the distribution of the preferred orientations of V1 neurons. Each dot represents a neuron. The hue represents the preferred orientation of the neuron, and the hue intensity represents the amplitude of the neuronal response to the presentation of its preferred orientation. (B) Schematic representation of the response of a SNN trained to discriminate the V1 population response to the presentation of a 30° drifting grating (top panel) and to the presentation of a 60° drifting grating (middle panel). When the SNN is provided with the response of its input cortical neuron population for the presentation of a 45° drifting grating (bottom panel), its output should indicate an equal probability that the stimulus belongs to the ‘30°’ and ‘60°’ categories. (C) Schematic representation of the SNN training. (D) Schematic representation of the SNN testing with a 45° stimulus that does not belong to the training categories. (E) Average output across 100 trials of the presentation of a 45° drifting grating of a randomly selected trained SNN. The dot indicates the orientation and length of the circular mean vector computed from the mean distribution of the SNN output. (F) Precision index defined as the length of the vector resulting from the projection of the circular mean vector onto the axis of the visual stimulus orientation.

