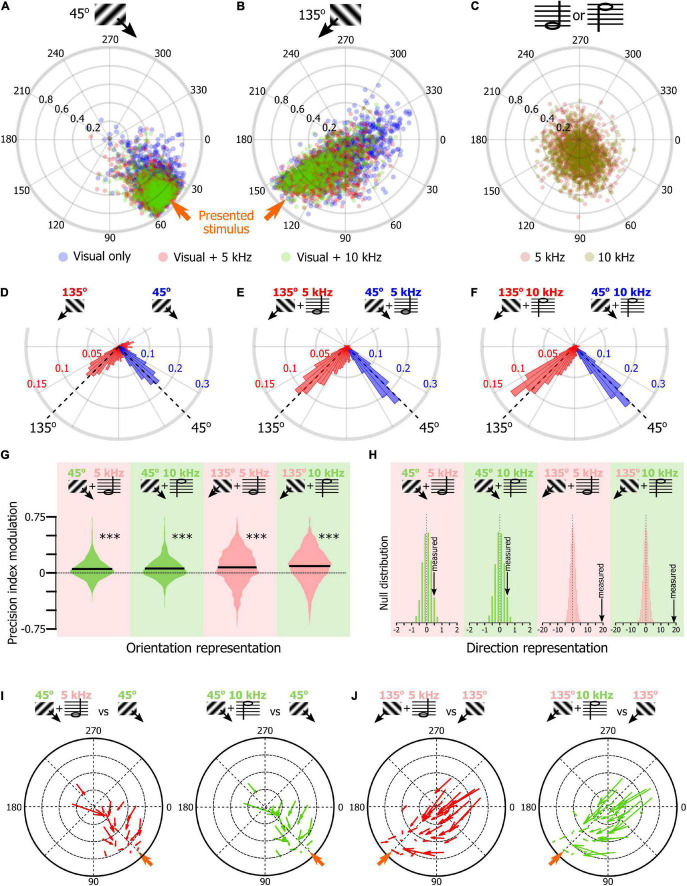
FIGURE 4.
Sound modulation of the V1 population evoked response in naïve mice. (A) Output of 1,000 SNNs made of 250 randomly selected V1 neurons to the presentation of a 45° drifting grating in the unimodal (blue) and audiovisual (5 kHz tone: red; 10 kHz: green) contexts. The orange arrow indicates the orientation of the presented stimulus. (B) Same representation as in panel (A) for the presentation of the 135° drifting grating. (C) Same representation as in panel (A) for the presentation of unimodal auditory stimuli (5 kHz tone, dark red; 10 kHz, dark green). (D) Distribution of the orientations indicated by the output circular mean of the 1,000 SNNs shown in panels (A,B) when the input is the neuronal activity evoked by the unimodal 45° (blue) and unimodal 135° (red) drifting grating. (E) Same representation as in panel (D) when the visual stimulus is paired with the 5 kHz tone. (F) Same representation as in panel (D) when the visual stimulus is paired with the 10 kHz tone. (G) Modulation by the 5 kHz (red background) and 10 kHz (green background) sounds of the precision indexes of the 1,000 SNN shown in panels (A,B). The black bar indicates the mean of the distribution. *** Random permutation test (p < 0.0001). (H) Comparison of the percent of SNN outputs shown in panels (A,B) changing direction when the visual stimulus was presented with one of the two sounds in panels (B,C) with the probability distribution of the same measure performed 10,000 times with shuffled data (from left to right: p = 0.02, p = 0.02, p < 0.0001, p < 0.0001). (I) Quiver plot of topographically clustered modulation vectors illustrating how SNNs with similar outputs for the presentation of the 45° drifting grating are modulated by the 5 kHz (red) and 10 kHz (green) sounds. (J) Same representation as in (I) for the presentation of the 135° drifting grating.

