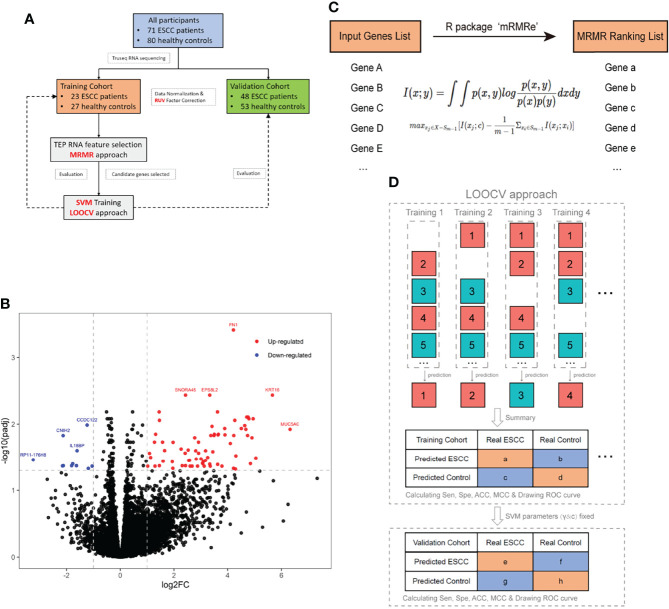
Figure 1.
Schematic representation of analysis pipeline and core methods used in this study. (A) Flowchart of participant distribution and data processing procedure. (B) A logistic regression model was used to perform differential expression analysis between ESCC and the control group. Seventy-four red- and 11 blue-colored dots indicated upregulated genes and downregulated genes in ESCC, respectively (|fold change| >2 and p adj < 0.05). FN1, KRT16, EPS8L2, SNORA45, and MUC5AC were most significantly upregulated and CCDC122, CNIH2, IL18BP, and RP11-176H8 were most significantly downregulated. (C) Schematic representation of the MRMR approach. Top 200 differentially expressed genes input into R-package mRMRe to generate a gene-ranking list for features selection with maximum relevance and minimum redundancy. (D) Schematic representation of the SVM/LOOCV model training and validation. In the training cohort, the SVM algorithm was trained to get optimal parameters of gamma and cost by all samples minus one, while the remaining sample was used for blind classification until every sample has been predicted. The search range for gamma and cost parameters of SVM algorithm were 10^(-10:1) and 2^(1:10) respectively. After LOOCV approach was completed in the training cohort, gamma and cost parameters were fixed to do binary classification in the validation cohort. For both cohorts, we got a confusion matrix and ROC curve of diagnosis for ESCC. ACC, accuracy; ESCC, esophageal squamous cell carcinoma; LOOCV, leave-one-out cross-validation; MCC, Matthews correlation coefficient; MRMR, minimal redundancy and maximal relevance; SVM, support vector machine; ROC, receiver operative characteristics.

