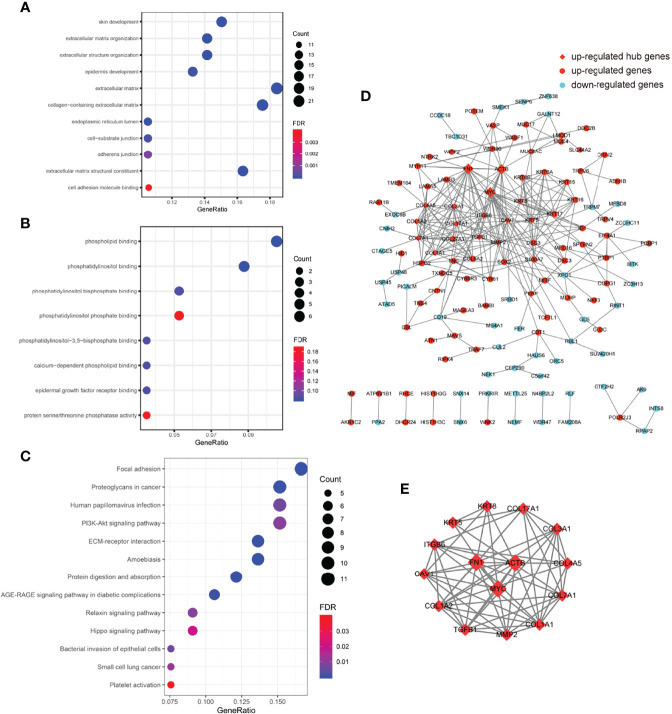
Figure 4.
Functional enrichment and gene co-expression network analysis. (A) Top 12 significantly enriched GO terms (FDR < 0.001, count >10) ranked by gene ratio in BP (top 4 items), CC (middle 5 items), and MF (bottom 2 items) of 143 upregulated genes in platelets of the ESCC group compared to the control group. (B) Enriched GO terms (FDR < 0.2) of 80 downregulated genes in platelets of the ESCC group compared to the control group. All the enriched GO terms belonged to MF. (C) Enriched KEGG terms (FDR < 0.05) of 143 upregulated genes in platelets of the ESCC group compared to the control group. (D) Two hundred and twenty-three DEGs imported to String to generate a gene co-expression network containing 132 nodes and 281 wedges. Red-colored dots indicated 85 upregulated genes and blue-colored dots indicated 47 downregulated genes. Red square indicated hub genes (FN1, ACTB, and MYC) with highest values of degree. (E) Top 15 hub genes ranked by degree (>12) in Cystoscope were highly clustered and centered among FN1, ACTB, and MYC. BP, biological process; CC, cellular component; DEGs, differentially expressed genes; ESCC, esophageal squamous cell carcinoma; FDR, false discovery rate; GO, Gene Ontology; KEGG, Kyoto Encyclopedia of Genes and Genomes; MF, molecular function.

