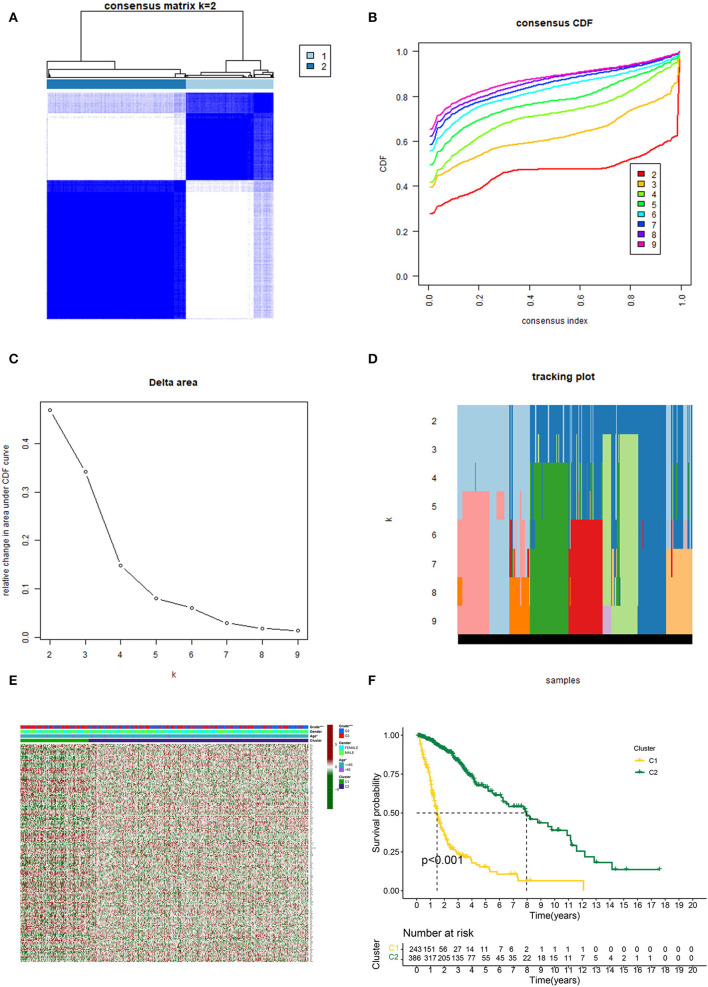
Figure 2.
Consistent cluster analysis of gliomas. (A) Consensus clustering matrix with k = 2. (B) Cumulative distribution function (CDF) for consistent clustering at k = 2–9. (C) For k = 2–9, the relative change in the area under the CDF curve. (D) Sample distribution for k = 2–9. (E) Heatmap and clinicopathologic characteristics of the two clusters established by the consensus expression of the m7G RNA methylation regulators (Red for high expression level, green for low expression level). (F) Comparison of Kaplan–Meier OS rates for overall survival (OS) curves in the two clusters (*p < 0.05, ***p < 0.001).

