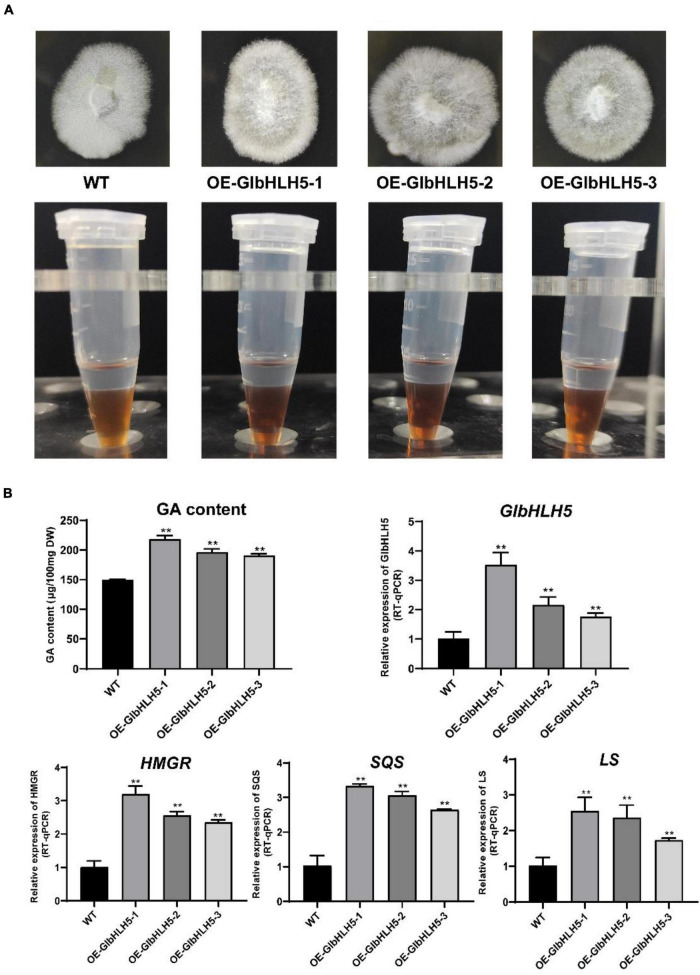
FIGURE 6.
Phenotypic and relative gene expressions analysis of the GlbHLH5 overexpression strains. (A) The phenotypes of the three GlbHLH5 overexpression and the control lines of Ganoderma lucidum and the coloration differences between extracts of different lines. (B) The quantitative analysis of triterpenoids and the key genes transcriptions of the biosynthetic pathway in the GlbHLH5 overexpression and the control lines. “**” means the difference is extremely significant (P < 0.01).

