Figure 6.
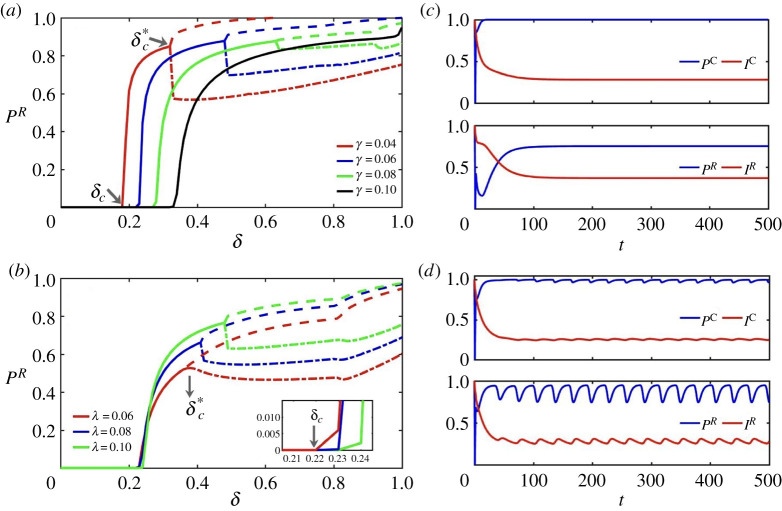
(a,b) Bifurcation diagrams for fraction of as a function of . The numerical results are obtained for the ER network with and . Parameters are , , , while in (a) and in (b). Bifurcation points and are shown in the figure. Solid lines denote stable fixed-points while dashed-dotted and dashed lines show the lower and upper turning points of stable limit cycles, respectively. (c,d) Numerical results for fraction of protected and infected compartments of both risky and concerned individuals in time on the ER network with and . Parameters are , , and in (c) and in (d) . (Online version in colour.)

