Figure 8.

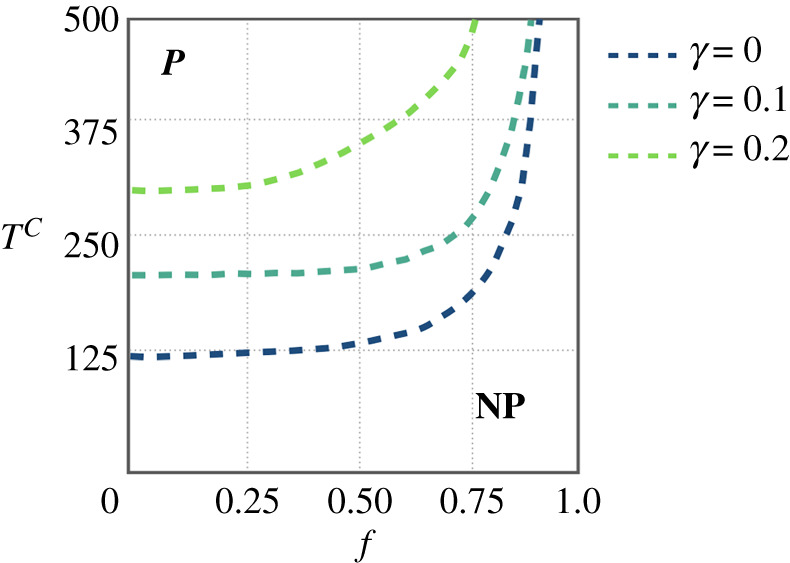
Protection threshold curves of the risky agents in space, for three different values and 0.2. The region wherein risky agents (do not) protect themselves is labelled as (NP) P which is (bottom) above each curve. (Online version in colour.)

Protection threshold curves of the risky agents in space, for three different values and 0.2. The region wherein risky agents (do not) protect themselves is labelled as (NP) P which is (bottom) above each curve. (Online version in colour.)