
Figure 9.
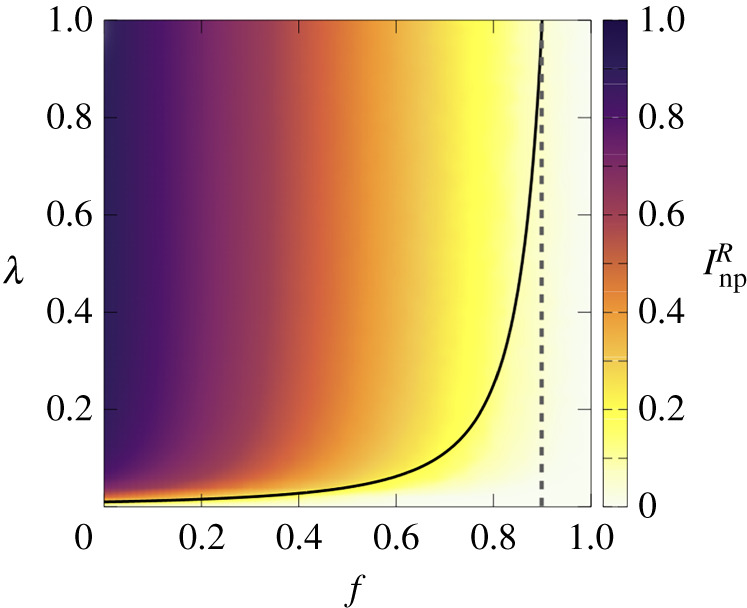
Phase diagrams for the fraction of infected risky agents, . The solid line indicates the analytical curve for the epidemic threshold, equation (3.10), while the dashed line indicates the critical value , equation (3.11). Parameters are set to , , , and on the ER network with and . (Online version in colour.)