Figure 2.
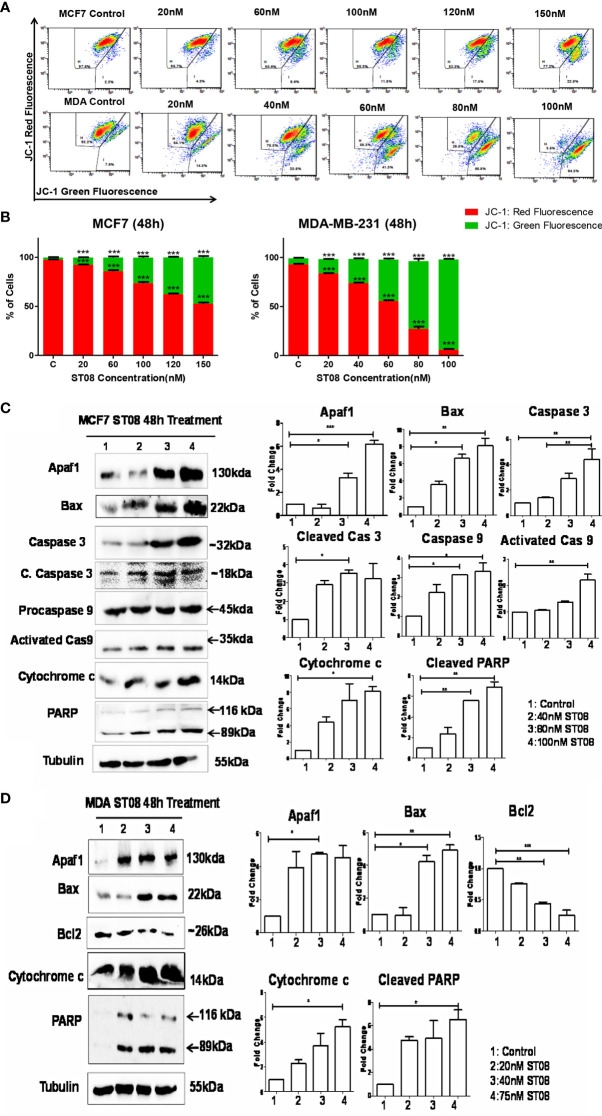
Evaluation of mitochondrial membrane potential(MMP) changes induced in breast cancer cells by JC-1 staining and Assessment of apoptotic protein markers in breast cancer cells treated with ST08: Dot plot depicting 48h treated MCF7, MDA-MB-231 cells by ST08 subjected to JC-1 staining (A). Quantification of high and low MMP (B) depicted as a bar graph after 48h treatment of ST08 on MCF7, MDA-MB-231 cells. Each experiment was repeated three times and represented as histograms. Two-way ANOVA test was performed and p-value was calculated between control and ST08 treated groups (*p < 0.05, **p < 0.005, ***p < 0.0001). Western blot analysis of apoptotic markers was done on ST08 treated MCF7 (C) and MDA-MB-231 (D) cell lysates. Each experiment was done in duplicates, and a representative image is shown for each marker. Quantification was done for each marker and is represented as a bar graph of mean +/- SEM. One sample t-test and one way ANOVA test was performed, and the p-value was calculated between control and ST08 treated groups (*: p-value < 0.05, **: p-value < 0.005).

