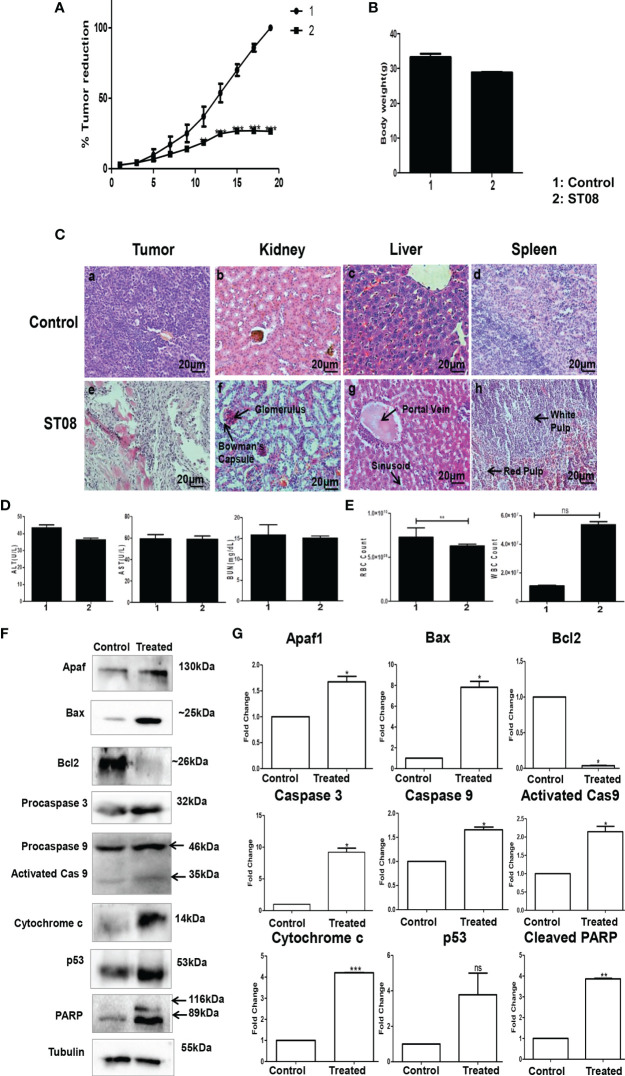
FIGURE 3 | Evaluation of the effect of ST08 on tumour growth: EAC cells (1 x 10⁶ cells/animal) were injected to induce solid tumours. After the 7th day of injection, i.p injection with ST08 (20mg/kg bd.wt) was started every alternate day throughout the experiment. (A) % Tumour volume reduction after ST08 treatment. (B) Body weight of animals at the end of the study. (C) Histopathological analysis of tumour and organs after ST08 treatment. At the end of the study, tumour tissue and organs were collected and used for histological analysis—representative images of H&E stained sections at 20X magnification of (a) control tumour, (e) ST08 treated tumour (b) control liver, (f) ST08 treated liver (c) control spleen, (g) ST08 treated Spleen (d) control kidney, (h) ST08 treated kidney. (D) Blood ALT, AST, Urease test results are plotted as bar graphs. Blood was collected at the end of the study. (E) WBC and RBC counts of experimental animals are plotted as bar graphs. (F) Effect of ST08 on the expression of apoptotic proteins in the tumour tissue of experimental animals. Tissue lysates were prepared from the dissected tumour samples of post treatments. 40 µg of protein was loaded in SDS-PAGE and checked for apoptotic protein expression by western blotting. (G) Quantification was done for each marker and is represented as a bar graph of mean +/- SEM. One sample t-test was performed, and the p-value was calculated between control and ST08 treated groups (*: p-value < 0.05, **: p-value < 0.005, ***: p-value < 0.001, ns, not significant).

An official website of the United States government
Here's how you know
Official websites use .gov
A
.gov website belongs to an official
government organization in the United States.
Secure .gov websites use HTTPS
A lock (
) or https:// means you've safely
connected to the .gov website. Share sensitive
information only on official, secure websites.
