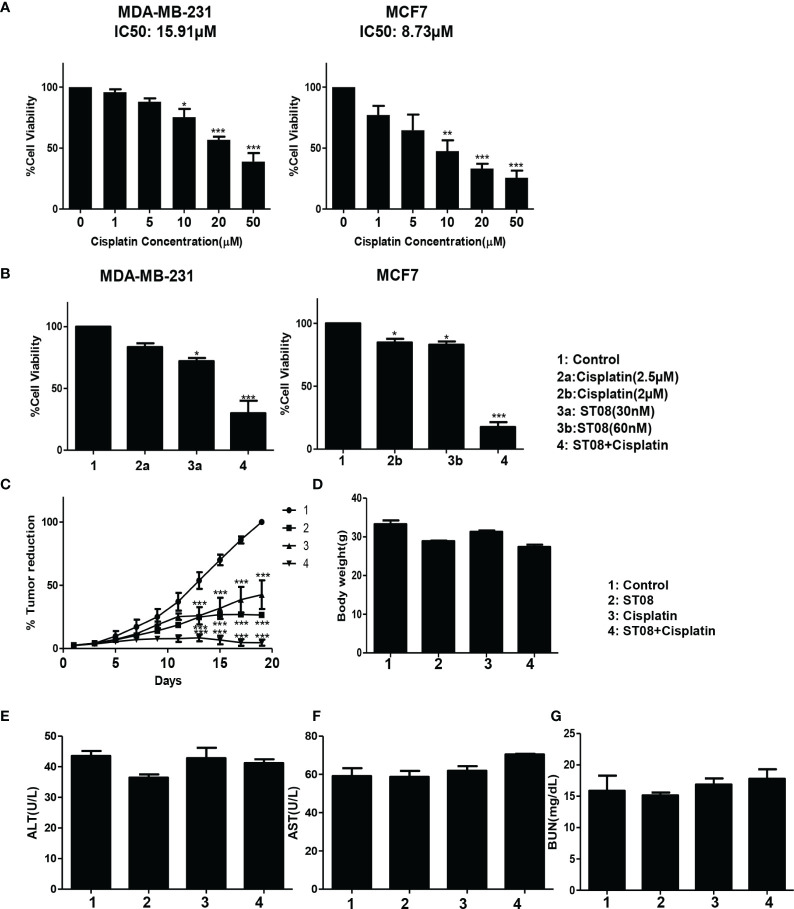
Figure 4.
Drug combination study in vitro and in vivo: Bar graph depicting cell viability upon Cisplatin (A) and Combination(ST08+Cisplatin) treatment (B) of 48h on breast cancer cell lines as tested by MTT assay. Experiments were performed a minimum of three times, and the bar graph shows mean ± SEM. Two-way ANOVA test was performed and p-value was calculated between control and treated groups (*p < 0.05, **p < 0.005, ***p < 0.0001). EAC cells (1 x 10⁶ cells/animal) were injected to induce solid tumours. After the 7th day of injection, i.p injection with ST08 (10mg/kg bd.wt), Cisplatin(1mg/kg bd.wt), and ST08+Cisplatin was started every alternate day throughout the experiment period. (C) % Tumour volume reduction after ST08, Cisplatin, ST08+Cisplatin treatment. (D) Body weight of animals at the end of the study. Blood ALT (E), AST (F), Urease (G) test results are plotted as bar graphs. Blood was collected at the end of the study.

