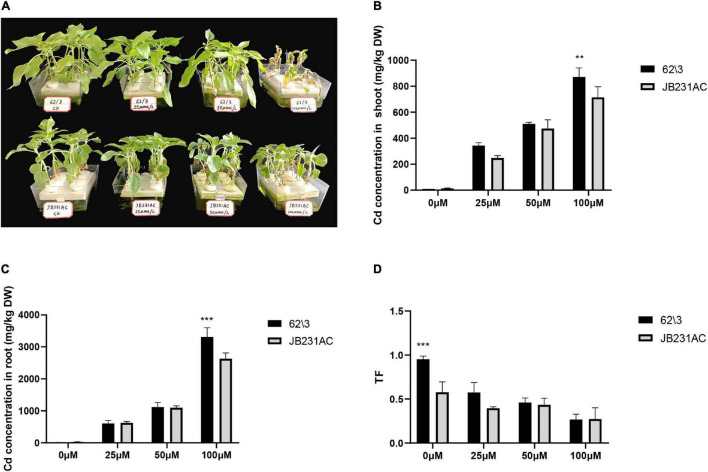
FIGURE 1.
Performance of growth and Cd accumulation of 62\3 and JB231AC genotypes. (A) Growth performance of 62\3 and JB231AC grown hydroponically under Cd stress for 7 days. (B) Cd concentration in the shoots of the seedlings. (C) Cd concentration in the roots of the seedlings. (D) TF (Translocation factor), the ratio of Cd concentration in shoots to that in roots. For (B–D) the statistical analyses were conducted using all the performance data of 62\3 and JB231AC under Cd stress. Data presented are the means (n = 3), and error bars denote the standard deviations. The asterisk represent the significant difference between 62\3 and JB231AC under one same Cd stress. **P < 0.01, ***P < 0.001.

