Figure 2.
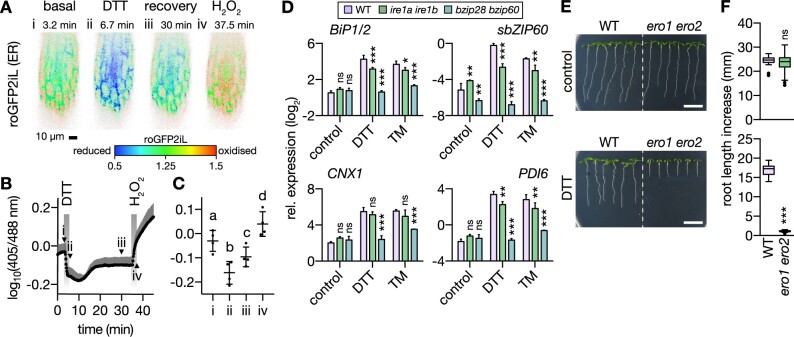
DTT causes reductive ER stress in roots of Arabidopsis seedlings. A–C, Four-day-old Arabidopsis seedling roots expressing ER lumen-targeted Grx1-roGFP2iL were perfused with control medium and exposed to 5 mM DTT or 10 mM H2O2, respectively. A, Ratiometric images of one root section during a representative time course experiment. High 405/488-nm excitation ratios indicate a less negative EGSH (red); low ratios indicate a more negative EGSH (blue). Images from four time points are shown and marked i–iv as indicated in (B). B, Corresponding time series data. N = 4. Mean + sd. Arrow heads indicate time points of images i–iv in (A). C, Indicated time points from (A) and (B). Mean ± sd. N = 4. Different letters indicate significant differences (one-way ANOVA with Tukey’s multiple comparisons test; P < 0.01). D, ER stress marker transcript quantification by RT-qPCR from roots of 12-day-old seedlings submerged in treatment solutions without (control) or with 2 mM DTT or 4.3 μg mL−1 TM for 2.5 h. Lines: WT Col-0, ire1a ire1b, bzip28 bzip60. Transcripts: BiP1/2, sbZIP60, CNX1, or PDI6. Expression level is shown relative to reference transcript TIP41. Mean + sd. N = 3 plates, with pooled roots from 18 to 20 seedlings each. Note that the stronger suppression in bzip28 bzip60 than in ire1a ire1b correlated with root growth suppression in the mutants in the presence of DTT (Deng et al., 2013). Differences were tested by two-way ANOVA with Dunnett’s multiple comparisons test (nsP > 0.05, *P < 0.05, **P < 0.01, ***P < 0.001). E, Representative images of WT and ero1 ero2 seedlings 4 days after transfer to new plates. Plants were grown vertically on half-strength MS agar plates for 4 days, then transferred to fresh plates without (control) or with 400 µM DTT. Scale bars: 10 mm. F, Primary root growth within 4 days after transfer on new plates. (Top) Control, N = 19–24. (Bottom) DTT, N = 18. Boxplot: first and third quartiles with median and Tukey’s whiskers. Differences were tested after log-transformation of data to establish normal distribution by one-tailed t-test (nsP > 0.05, ***P < 0.001). P-values: Supplemental Data Set 2.

