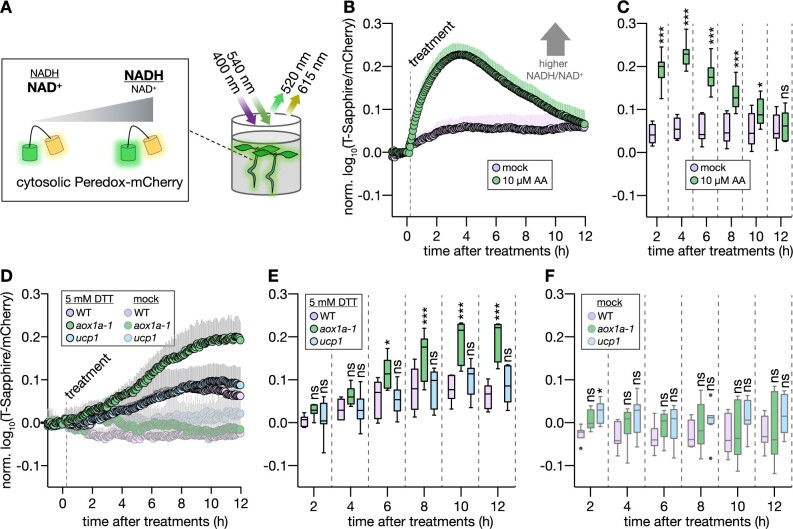
Figure 5.
In vivo monitoring of the cytosolic NAD redox state reveals increased NAD reduction in Arabidopsis aox1a seedlings following DTT exposure. A, Schematic representation of plate reader-based fluorimetry to monitor NAD redox dynamics in the cytosol of Arabidopsis seedlings. B, Time series of four-day-old WT Col-0 seedlings expressing cytosolic Peredox-mCherry. T-Sapphire and mCherry fluorescence intensities were recorded from seedlings in assay medium and the autofluorescence from corresponding WT controls without sensor were used for background subtraction. T-Sapphire: excited at 400 ± 5 nm, emission collected at 520 ± 5 nm; mCherry: excited at 540 ± 10 nm, emission collected at 615 ± 9 nm. Dashed line indicates addition of mock or AA. High T-Sapphire/mCherry emission ratios indicate a more reduced NAD pool. N = 7–15. Mean + sd. C, Indicated time points from (B). N = 7–15. D, Time series as in (B), but with WT and mutants, aox1a-1 and ucp1 treated with mock or DTT. E, Indicated time points from (D). N = 7. F, Indicated time points from (D). N = 6–8. Boxplots: first and third quartiles with median and Tukey’s whiskers. Significant differences compared to mock treatment (C) or WT (E, F) according to two-way ANOVA with Dunnett’s multiple comparisons test (nsP > 0.05, *P < 0.05, **P < 0.01, and ***P < 0.001). P-values: Supplemental Data Set 5.

