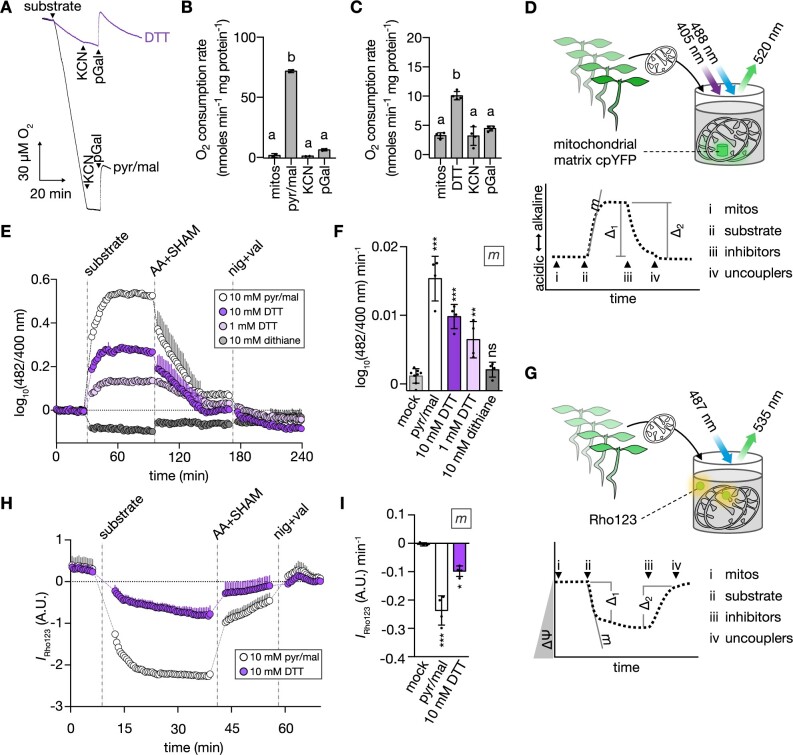
Figure 6.
Electrons from thiols can induce oxygen consumption, ΔpH, and ΔΨ in isolated mitochondria. A, Representative polarographic traces from oxygen consumption assays with purified mitochondria from 14-day-old WT Col-0 Arabidopsis seedlings. Arrow heads indicate additions of reagents to mitochondria. Black trace: 10 mM pyruvate + 10 mM malate + 0.3 mM NAD + 0.1 mM thiamine pyrophosphate (substrate; pyr/mal); violet trace: 10 mM DTT (substrate); both traces: 1 mM KCN, 0.2 mM pGal. B and C, Corresponding oxygen consumption rates from (A). Mean ± sd. (B) N = 2, (C) N = 4. Different letters indicate statistical differences according to repeated measures ANOVA with Tukey’s multiple comparisons test (P < 0.01). D, Schematic representation of plate reader-based fluorimetry to monitor pH dynamics in the mitochondrial matrix. (Left) purified mitochondria from 14-day-old Arabidopsis seedlings expressing the mitochondrial matrix-localized cpYFP. CpYFP was sequentially excited at 400 ± 5 nm and 482 ± 8 nm, emission recorded at 520 ± 5 nm. Right: pH dynamics in the mitochondrial matrix in response to i–iv. i: inactive mitochondria. ii: substrates to restore mETC activity and ΔpH across the inner mitochondrial membrane. iii: inhibitors to arrest mETC activity and passively dissipate ΔpH. iv: uncouplers to fully degrade ΔpH. m: slope of linear phase in response to substrate addition; Δ1: substrate-induced cpYFP ratio difference; Δ2: mETC inhibitor-induced cpYFP ratio difference. Δ1 and Δ2: Supplemental Figure S8, D and E. E, pH dynamics in the mitochondrial matrix as in (D). CpYFP fluorescence ratio depicted as deviation from mean of mock treatment (dotted line at y = 0). Increase or decrease of ratio indicate more alkaline or more acidic pH, respectively. N = 4. Mean + sd. Vertical dashed lines indicate additions of substrates, mETC inhibitors (AA: 20 μM, SHAM: 2 mM salicylhydroxamic acid) and uncouplers (nig: 50 μM nigericin, val: 10 μM valinomycin). F, Corresponding m (slope) from (E). N = 4–8. Mean ± sd. G, Schematic representation of the plate reader-based fluorimetry to monitor dynamics of ΔΨ. Sensor-free mitochondria were incubated with the ΔΨ-sensitive dye Rho123. H, ΔΨ dynamics of mitochondria in response to different substrates recorded as described in (G). Rho123 was excited at 487 ± 7 nm, emission collected at 535 ± 15 nm. N = 3–4. Mean + sd. Vertical dashed lines as in (E). I, Corresponding m (slope) from (H). N = 3–4. Mean ± sd. Significant differences between treatments according to one-way ANOVA with Dunnett’s multiple comparisons test (nsP > 0.05, *P < 0.05, **P < 0.01, ***P < 0.001). P-values: Supplemental Data Set 6.

