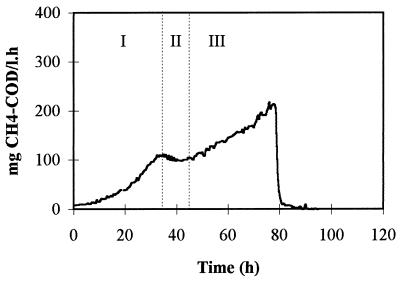
FIG. 1.
Methane production rate curve for methanol-degrading sludge. The following three phases were distinguished: (i) an exponential methane production rate (phase I), (ii) a decrease in the rate (phase II), and (iii) an additional arithmetic increase in the rate (phase III). Ni and Co were each added at a concentration of 1 μM.

