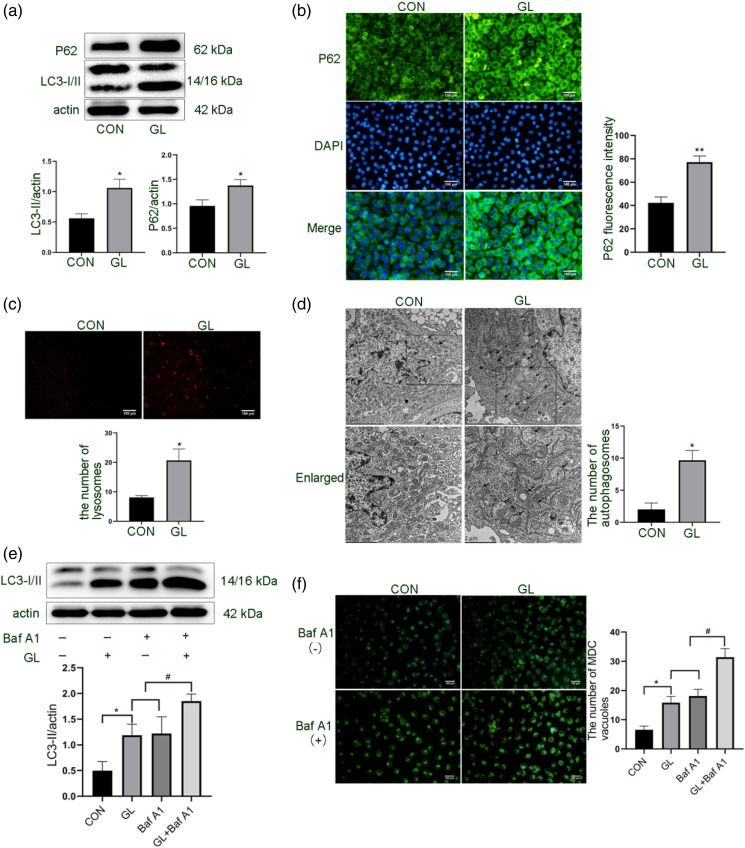
Figure 1.
Effect of glucolipotoxicity on autophagic activation and autophagic flow of HUVECs. Cells were treated with 30 mM glucose and 100 μM palmitic acid (GL) for 24 h. A. Expression levels of autophagy proteins LC3 and P62 were detected by Western blot. B. Immunofluorescence detection of P62 expression in cells. Scale bar: 100 μm. C. Quantification of cellular lysosome numbers by Lyso-Tracker Red dye. Scale bar: 100 μm. D. Transmission electron microscopy observation of autophagosomes and autolysosomes in cells. Scale bar: 2/5 μm. E. Western blot analysis of LC3 conversion in cells pretreated with Baf A1 (50 nM) for 2 h and then treated with GL for 24 h. F. MDC staining of autophagic vacuoles. Scale bar: 100 μm. The band densities of LC3-II (A and E) and P62 (A) were quantitated and normalized to those of corresponding loading control Actin. The mean fluorescence intensity of P62 (B), the number of lysosomes (C), the number of autophagosomes (D), and the number of MDC vacuoles (F) were quantitated or counted in the whole field. Representative images are shown or data are expressed as mean ± SD (n = 3) *p < 0.05 vs control group and #p < 0.05 vs GL group or Baf A1 group. CON = control group; GL = glucolipotoxicity group; Baf A1= bafilomycin A1 group; GL+ Baf A1 = glucolipotoxicity + bafilomycin A1 group; MDC= monodansylcadaverine.

