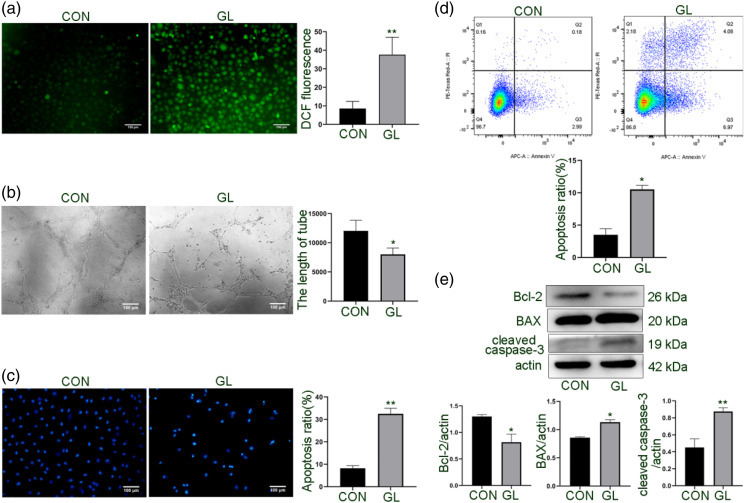
Figure 2.
Effect of glucolipotoxicity on tubular formation and apoptosis of HUVECs. Cells were cultured for 24 h under glucolipotoxic conditions, as described in Figure 1. A. Detection of intracellular ROS production by a fluorescent probe DCFH-DA. The mean fluorescence intensity of ROS was quantitated in the whole field. B. Evaluation of the capillary structure formation of cells on Matrigel and quantification of the tubule length with the ImageJ. Scale bar: 100 μm. C. Quantification of apoptotic cells by Hoechst 33258 staining. The nuclei of apoptotic cells are concentrated, dense, and high blue. Scale bar: 100 μm. D. Flow cytometric analysis of cell apoptosis rate with Annexin V-Alexa Fluor 647/PI staining. E. Western blot analysis of the expression of apoptotic protein BAX, cleaved caspase-3 and anti-apoptotic protein Bcl-2. The band densities were quantitated. Representative images are shown or data are expressed as mean ± SD (n = 3). *p < 0.05 vs control group and **p < 0.01 vs control group. CON = control group; GL= glucolipotoxicity group; PI, propidium iodide; ROS, reactive oxygen species.

