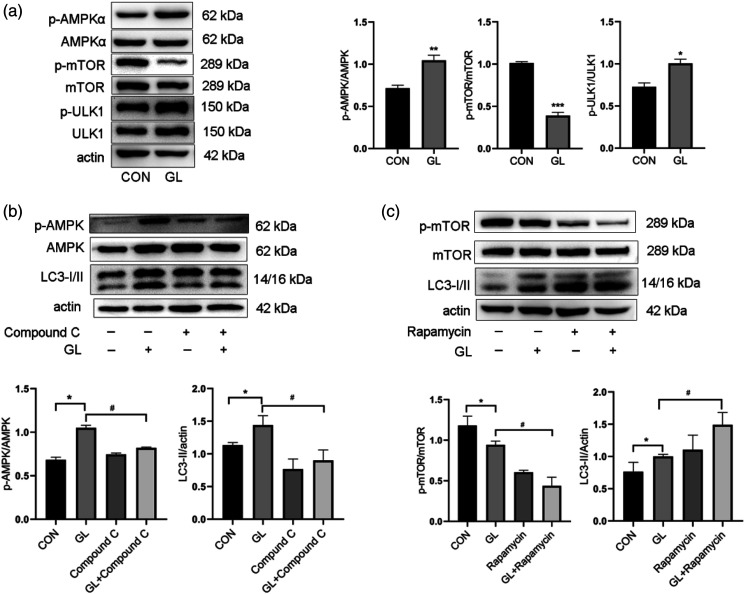
Figure 4.
The involvement of AMPK/mTOR/ULK1 pathway in autophagy induction by glucolipotoxicity in HUVECs. A. Western blot analysis of AMPK, mTOR, and ULK1 phosphorylation in cells exposed to glucolipotoxicity for 24 h. B. Western blot analysis of AMPK phosphorylation and LC3 expression in cells treated with AMPK specific inhibitor Compound C (5 μM) and glucolipotoxicity for 24 h. C. Western blot analysis of mTOR phosphorylation and LC3 expression in cells pretreated with mTOR inhibitor rapamycin (100 nM) for 2 h and then treated with glucolipotoxicity for 24 h. Representative images are shown or data are expressed as mean ± SD (n = 3). *p < 0.05 vs control group, **p < 0.01 vs control group, ***p < 0.001 vs control group, and #p < 0.05 vs GL group. CON = control group; GL = glucolipotoxicity group; GL+ Compound C = glucolipotoxicity + Compound C group; GL+ Rapamycin = glucolipotoxicity+ rapamycin group.

