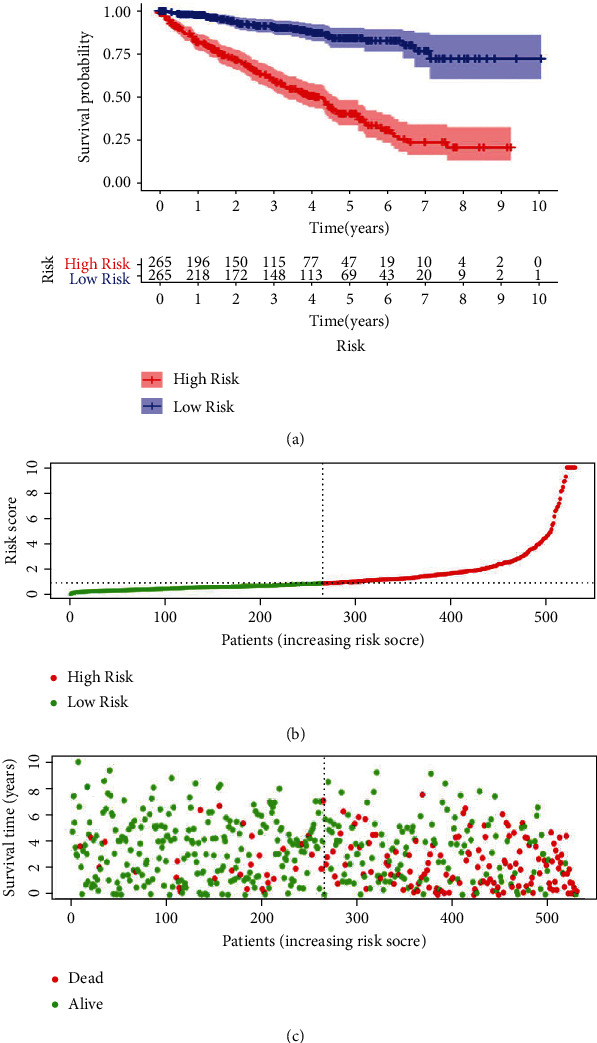
Figure 2.

The autophagy-related prognostic model on the patients of ccRCC. (a) The Kaplan-Meier curve revealed a fact that the high-risk group came in a shorter OS value than the low-risk one. (b) Prognostic model distribution on the patients of ccRCC. (c) OS value of patients in the TCGA dataset. The region of red color indicated a higher risk score whereas the green color meant lower risk.
