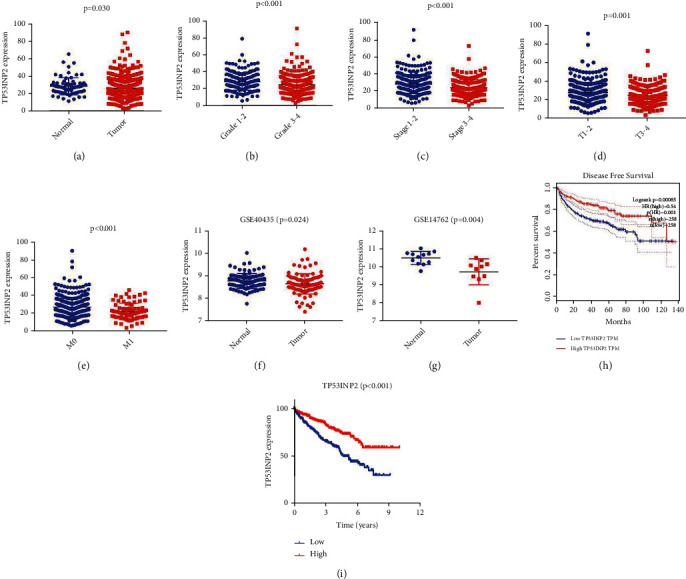
Figure 5.

TP53INP2 expression and ccRCC patients' clinical data from the TCGA dataset and the GSEA analysis. The TP53INP2 expression in ccRCC tissues (a), Fuhman grade (b), American Joint Committee on Cancer (AJCC) stage (c), TNM status (d) and (e) based on TCGA dataset. (f) and (g) The TP53INP2 expression in ccRCC tissues based on GSEA analysis. (h) and (i) Low expression of TP53INP2 was associated with worse overall survival in Kaplan-Meier curves.
