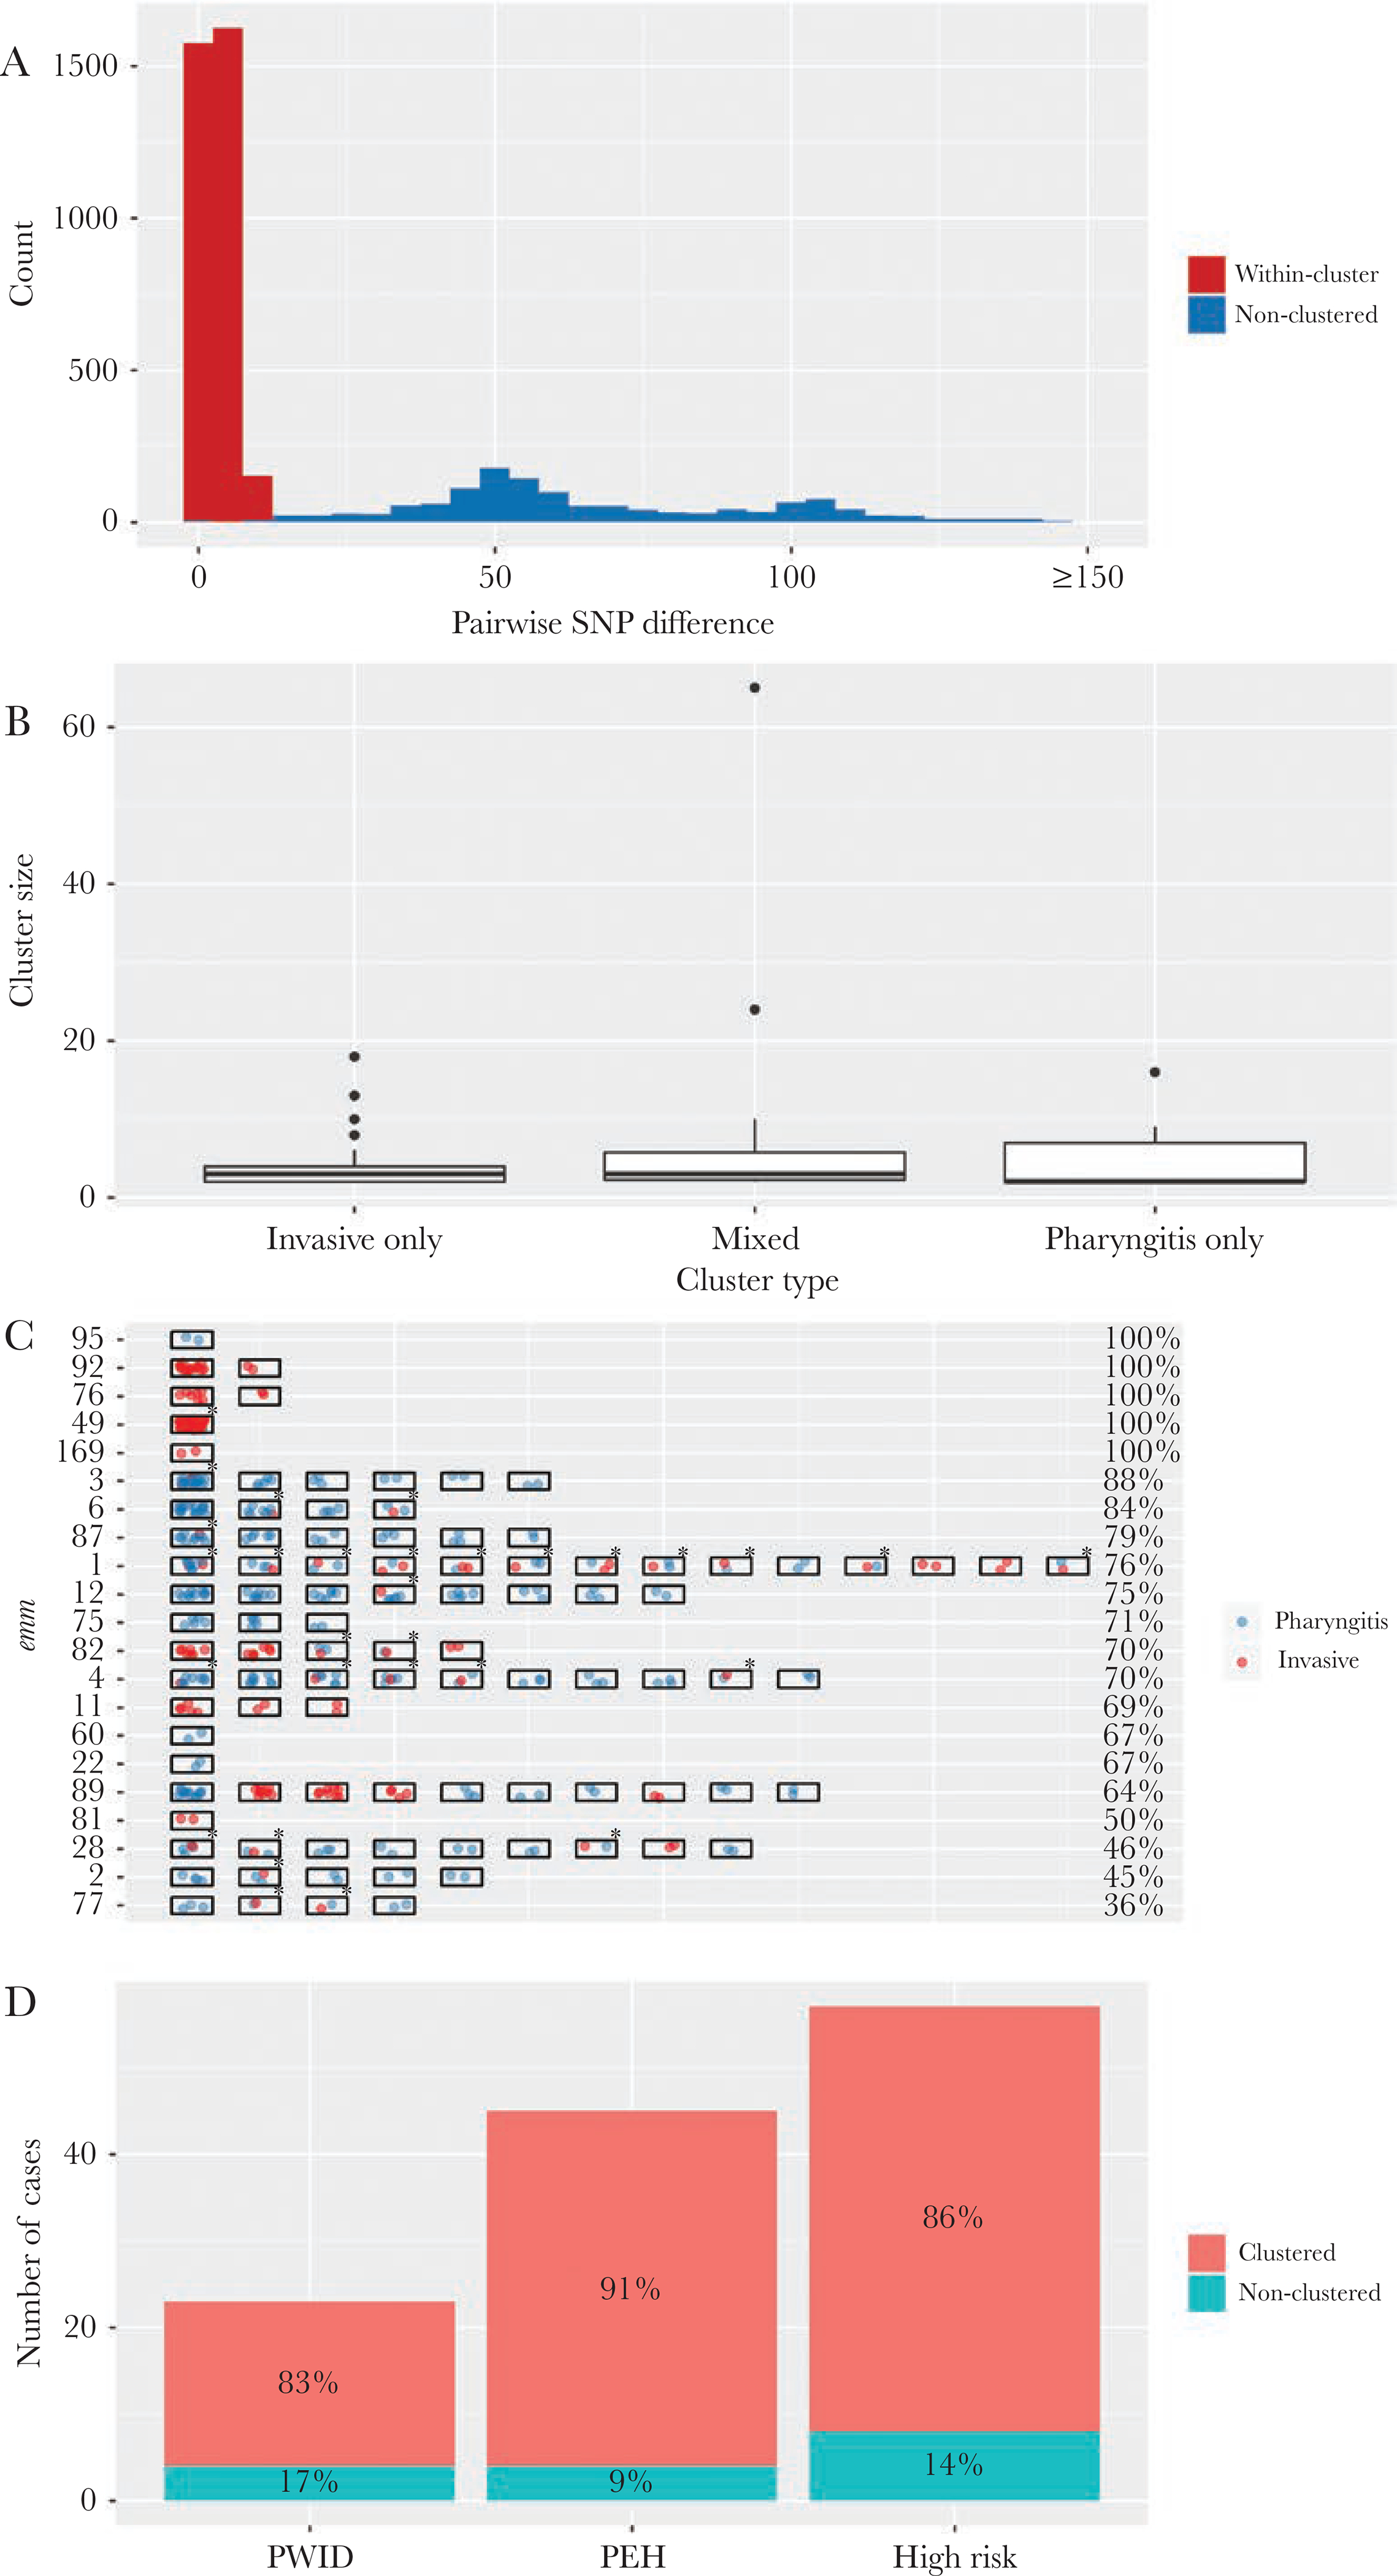
Figure 4.

Clusters of genomically closely related pharyngitis and invasive Group A streptococcus isolates, Colorado, June 2016 to April 2017. (A) Distribution of single-nucleotide polymorphism (SNP) distance between a pair of emm-matched isolates that were within a same cluster (red, 3340 pairs) or nonclustered (blue, 1316 pairs). (B) Box-plot of cluster size (number of isolates within a cluster) by cluster type. (C) Clustered isolates within individual emm types. Each rectangle represents a cluster containing 2 or more isolates. Each spot within the rectangle indicates a pharyngitis isolate (blue) or an invasive isolate (red). An asterisk indicates a mixed cluster. The percentage of clustered isolates in each emm is shown at the end of the row. Only emm types in which at least 1 cluster was detected are shown. (D) Clustered isolates among invasive disease cases from people who injected drugs ([PWID] n = 45), who were experiencing homelessness (PEH, n = 23), and who had either of the 2 conditions (high risk, n = 57). Percentages of isolates that belong to a cluster among these patients are shown.
