Figure 2.
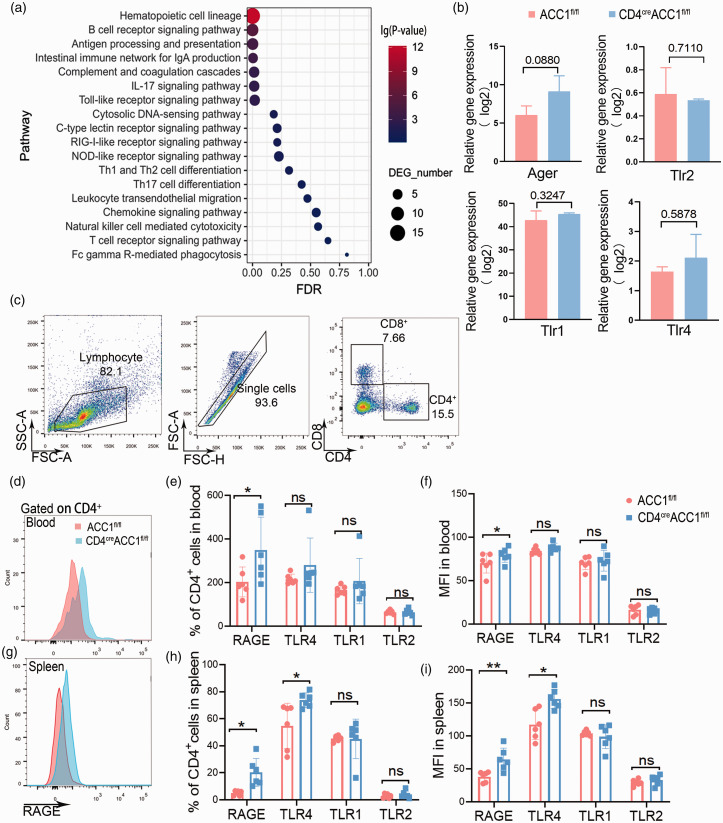
RAGE relays the ischemic signal and leads to metabolic reprogramming of CD4+ T cells. A: KEGG pathway enrichment analysis of immune pathway between the CD4+ T cells from CD4 cre ACC1 fl/fl and ACC1 fl/fl mice after MCAO. B: Relative gene expression of different pattern recognition receptors. C: Representative dot plots and gating strategy for CD4+ T cells sorting followed by flow cytometry. D-I: Representative and quantification of flow cytometry expression of RAGE, TLR1, TLR2, and TLR4 on CD4+ T cells from CD4 cre ACC1 fl/fl and ACC1 fl/fl mice after MCAO. RAGE MFI of CD4+ T cell after MCAO (D, G). Quantification of flow cytometry expression of RAGE, TLR1, TLR2, and TLR4 from CD4+T cells from blood and spleen of CD4 cre ACC1 fl/fl and ACC1 fl/fl mice after MCAO. n = 6 per group. RAGE, the receptor for advanced glycation end products; TLR, Toll-like receptor; FSC, forward scatter; MFI, mean fluorescence intensity; SSC, side scatter. Data are expressed as mean ± SD. *P ≤ 0.05 and **P ≤ 0.01. One‐way ANOVA, Bonferroni post hoc test.

